


- AAVE price surges despite recent bearish dominance.
- MACD suggests bearish momentum subsiding and potential price increase.
- Positive CMF indicates money continually entering the market for near-term rise.
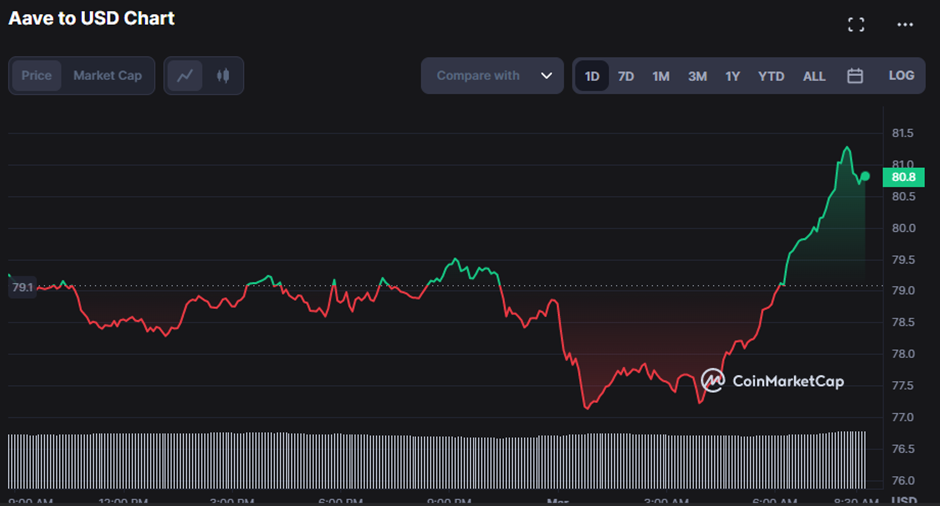
Aave (AAVE) price dropped to a 7-day week low of $77.11 in the previous 24 hours as a negative control of the market gained traction. Recently, though, bulls have pushed the bear rule under the rug and driven the price up to an intraday high of $80.83. As of this writing, AAVE’s price has risen by 2.01% to $80.81.
The market cap surged by 1.96% to $1,138,300,457, and the 24-hour trading volume climbed by 5.70% to $67,398,826. This surge indicates a strong showing from the bulls, who were able to shrug off bearish dominance and drive the price up to $80.81 from the 7-day low of $77.11.
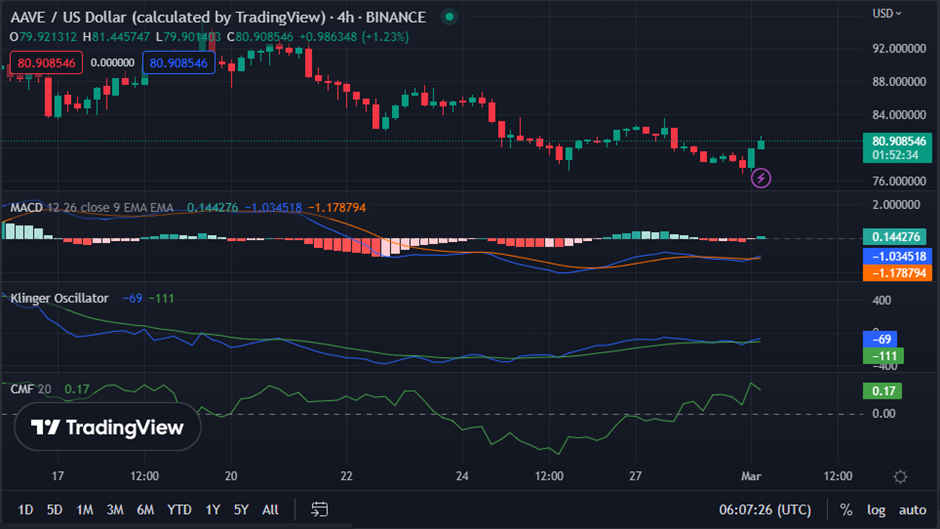
The MACD blue line has recently gone above its signal line with a value of -1.035359 and is going north. This move suggests that the market’s bearish momentum is beginning to subside and that the prices may increase.
This move might indicate that the trend is shifting, and investors should look for future buying opportunities. In addition, the fact that the histogram has crossed into the positive zone at 0.142781 confirms that the market is beginning to recover.
While the Klinger Oscillator is still in negative territory, with a value of -70, waiting for more confirmation before investing is prudent, as the negative momentum has not yet subsided entirely.
On the other hand, its advance above its signal line towards the “0” line is a bullish indication for the market and may change investor attitude. This surge in buying pressure might signal a trend reversal as investors become more enthusiastic about the market.
Yet, the Chaikin Money Flow (CMF) indicator is positive, with a value of 0.17. This reading signifies that money is continuously entering the market. Therefore, as long as the CMF is positive, the market will continue to rise in the near term.
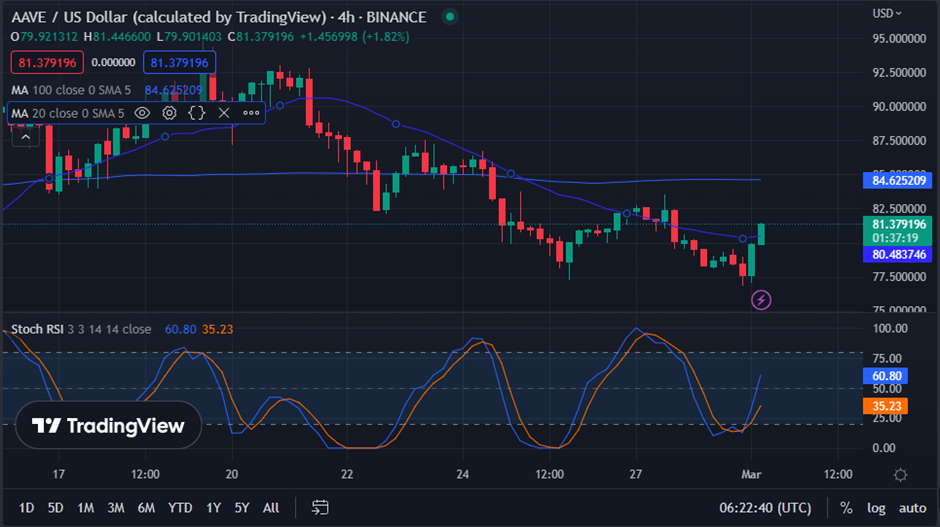
The price chart for AAVE shows a bearish crossover, with the 100-day moving average reaching 84.622377 and the 20-day moving average contacting 80.471926. This shift suggests that although AAVE is now positive, the bear hand is still there in the market. Moreover, indicated by the lower 20-day moving average, this bearish crossing means the bullish market may not endure much longer.
While the bearish crossing is still a possible warning sign of future price volatility, developing a green candlestick pattern and a subsequent move past the 20-day MA towards the 100-day MA implies that AAVE aims to continue in its present uptrend.
With a stochastic RSI value of 60.80 and trending north, current market sentiment is still optimistic, suggesting that the AAVE market is gaining bullish momentum. Traders should nevertheless be wary of the bearish crossing as a warning indicator and keep an eye on it for optimal portfolio management and profitability.
AAVE’s price has rebounded from its 7-day low and is showing signs of a potential trend reversal, but caution is advised due to the bearish crossover and ongoing volatility.
Disclaimer: The views and opinions, as well as all the information shared in this price prediction, are published in good faith. Readers must do their research and due diligence. Any action taken by the reader is strictly at their own risk. Coin Edition and its affiliates will not be held liable for any direct or indirect damage or loss.
Disclaimer: The information presented in this article is for informational and educational purposes only. The article does not constitute financial advice or advice of any kind. Coin Edition is not responsible for any losses incurred as a result of the utilization of content, products, or services mentioned. Readers are advised to exercise caution before taking any action related to the company.
 Price Prediction 2026, 2027, 2028, 2029, 2030 -2050")


