


 Explode Beyond $127 in the Next Bull Run?")
- XRP’s price could reach $127 if history repeats itself, an analyst opined.
- The short-term price action could leave the token consolidating around $0.50 as indicated by the EMAs.
- If Ripple outrightly wins against the SEC, XRP’s may rally, but $127 seems a little far off.
The Ripple (XRP) community may have been disappointed by the token’s performance in recent times. But according to crypto educator Toray Kortan, those who stick to holding XRP may reap the fruit of their trust in the token in the next bull run. Kortay, who is also the founder of Innovation Markets posted on Twitter (now X), that XRP could reach $127.11 soon.
History Set to Repeat Itself
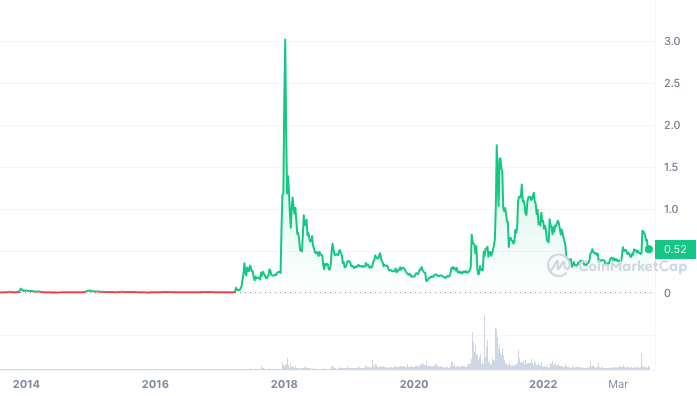
To support his claims, the analyst referred to XRP’s historical price performance. He noted that XRP had formed a Duplex Dip Vortex Springboard, which was similar to the market structure before the 2017 bull run.
The Duplex Dip Vortex Springboard refers to a technical pattern that indicates a possible rally of an asset. While the pattern rarely happens, it was the catalyst that triggered XRP’s rise from $0.21 to $2.7 in 2017.
Also, the hike was instrumental to the formation of the cult-like XRP Army who have stuck to the token through thick and thin.
However, XRP’s potential to reach $127 or not may not depend on the technical outlook. For instance, when the token surged to its All-Time High (ATH), XRP was not deemed a security. But with the recent regulatory issues, XRP may need the influence of macro external factors if it would ever get close to the aforementioned price.
If Ripple wins against the U.S. SEC again in the Appeal court, then XRP may repeat its performance from its initial win. However, reaching $127 is something that seems very unrealistic in the short term.
XRP Hangs Around $0.50
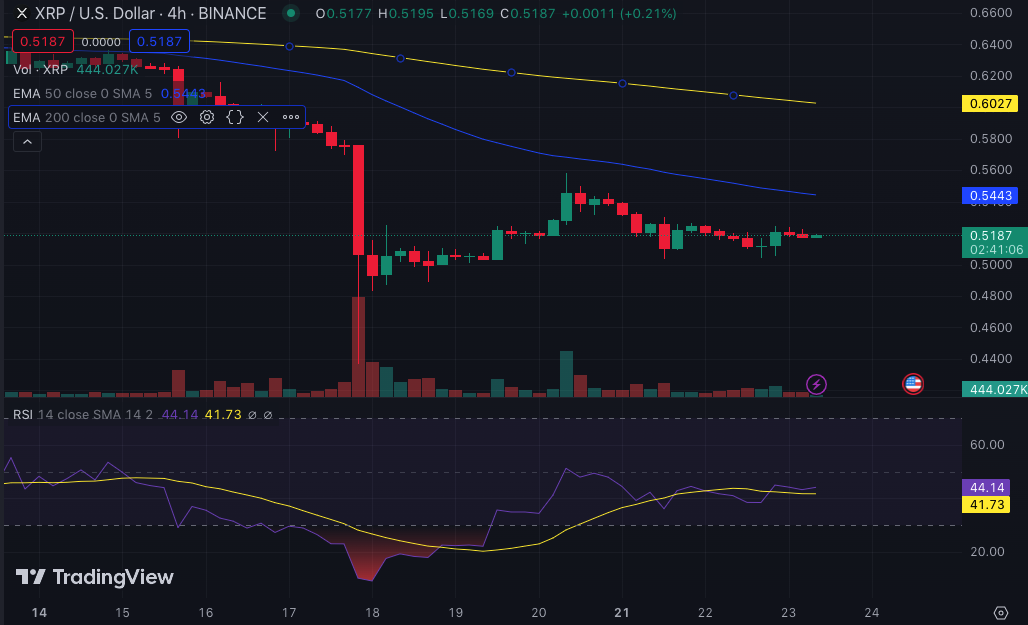
While the bull run may offer such potential, the prediction seemed far-fetched from XRP’s current value at $0.50. From the technical angle, the Exponential Moving Average (EMA) suggests that XRP’s current price action was bearish.
At the time of writing, the 200-day EMA (yellow) was above the 50-day EMA (blue). For a short-term approach, traders should look to sell. This is because the EMA structure signals the absence of an uptrend.
However, in the long term, a crossover of the 200 EMA over the 50 EMA could indicate a bullish price action. When it comes to momentum, the Relative Strength Index (RSI) showed that XRP was stagnant at around 44.14.
Since the RSI was closer to the neutral value of 50, it implies that there was a dearth of buying and selling of the token. Therefore, XRP may continue to consolidate.
Should in case Ripple wins outrightly against the SEC, XRP could go parabolic. But at the same time, a rise to $127 seems a little bit unrealistic. However, this is not to say it is not feasible.
Disclaimer: The views, opinions, and information shared in this price prediction are published in good faith. Readers must do their research and due diligence. Any action taken by the reader is strictly at their own risk. Coin Edition and its affiliates will not be liable for direct or indirect damage or loss
Disclaimer: The information presented in this article is for informational and educational purposes only. The article does not constitute financial advice or advice of any kind. Coin Edition is not responsible for any losses incurred as a result of the utilization of content, products, or services mentioned. Readers are advised to exercise caution before taking any action related to the company.


