


 Bulls Need to Break $0.2621 Resistance for Additional Gain")
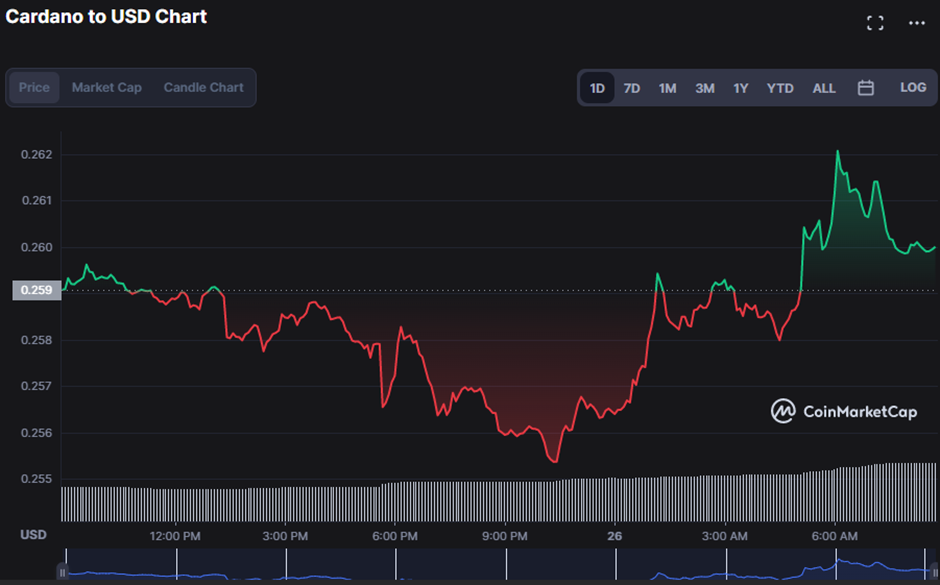
- As of the previous trading day, ADA has support at $0.2553 and resistance at $0.2621.
- In the last few hours, ADA’s price has been pushed up by more than 0.31%.
- Despite recent market volatility, Cardano (ADA) price analysis indicates a positive market bias.
Following a period of selling pressure that sent ADA prices to a session low of $0.2553, bulls have regained control of the market, pushing ADA’s price up by 0.31% to its current level of $0.2599.
Supporting the positive trend on the ADA market, the market capitalization and the 1-day trading volume both increased by 0.38% to $8,968,969,732 and 69.83% to $149,910,675, respectively.
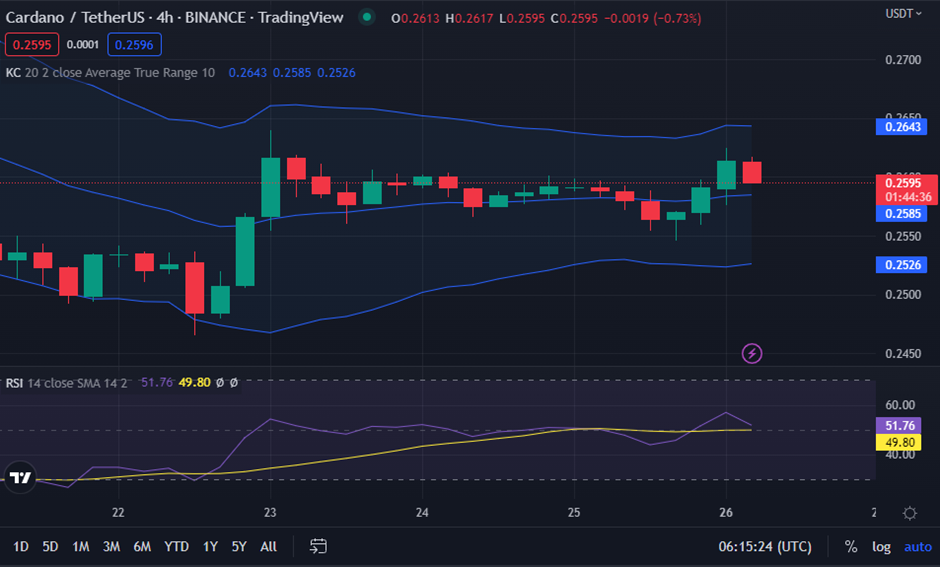
As market volatility rises, Keltner channel bands on the 4-hour price chart enlarge. The intersection of the top and lower bands, with values of 0.2644 and 0.2585, lends support to this notion. As a bullish indication, it is supported by the price’s recent movement toward the upper range, which is consistent with a continuous upward trend.
The RSI reading for the ADA price chart shows that the market is neither oversold nor overbought, but that buying pressure is higher than selling pressure, pointing to an upward trend. Since the RSI reading is over 50, it is clear that the value of the asset is increasing. However, investors’ anxieties are amplified by the RSI’s downhill trend, which indicates a bear market correction if the RSI drops below its signal line.
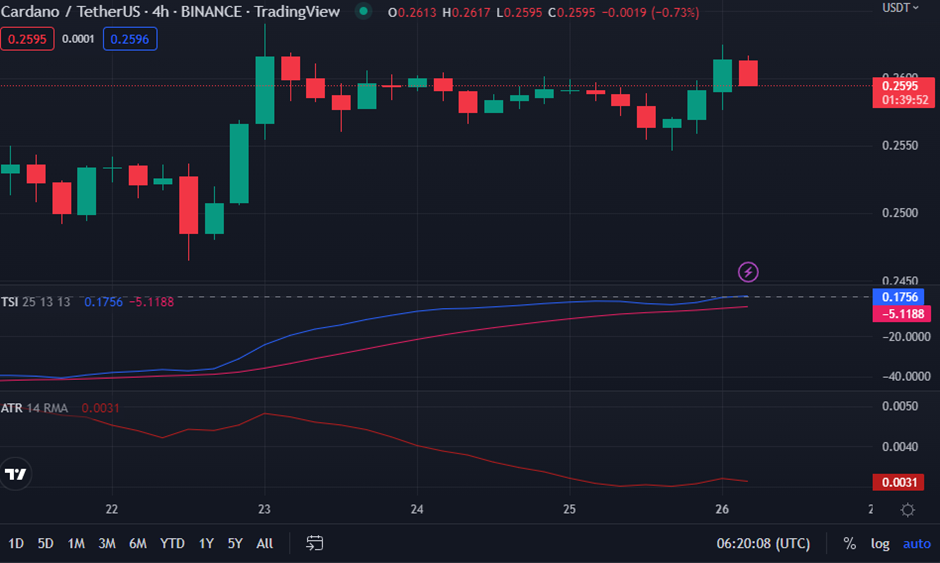
If the True Strength Indicator (TSI) continues to climb above its signal line, it signals that bulls are regaining control of the market and that the uptrend is likely to continue, so increasing the chances of investors. Despite the fact that the signal line is at -5.1188, the TSI is 0.1756. This TSI rise into positive territory adds to traders’ confidence for the foreseeable term.
Cardano’s (ADA) volatility is decreasing, as seen by the ATR line, which is presently at 0.0031 and sloping south. Furthermore, this ATR change is a cautionary indication for traders to continue with caution.
In general, the bears seem to be weary, and the technical indicators’ upward movement suggests the bullish trend may continue.
Disclaimer: The views and opinions, as well as all the information shared in this price prediction, are published in good faith. Readers must do their research and due diligence. Any action taken by the reader is strictly at their own risk. Coin Edition and its affiliates will not be held liable for any direct or indirect damage or loss.
Disclaimer: The information presented in this article is for informational and educational purposes only. The article does not constitute financial advice or advice of any kind. Coin Edition is not responsible for any losses incurred as a result of the utilization of content, products, or services mentioned. Readers are advised to exercise caution before taking any action related to the company.

: What Happens If You Use an Unlicensed Platform?")


