


- Recent data reveals that the Polygon market is dominated by bulls.
- Bulls must apply pressure in order to render indicator forecasts invalid.
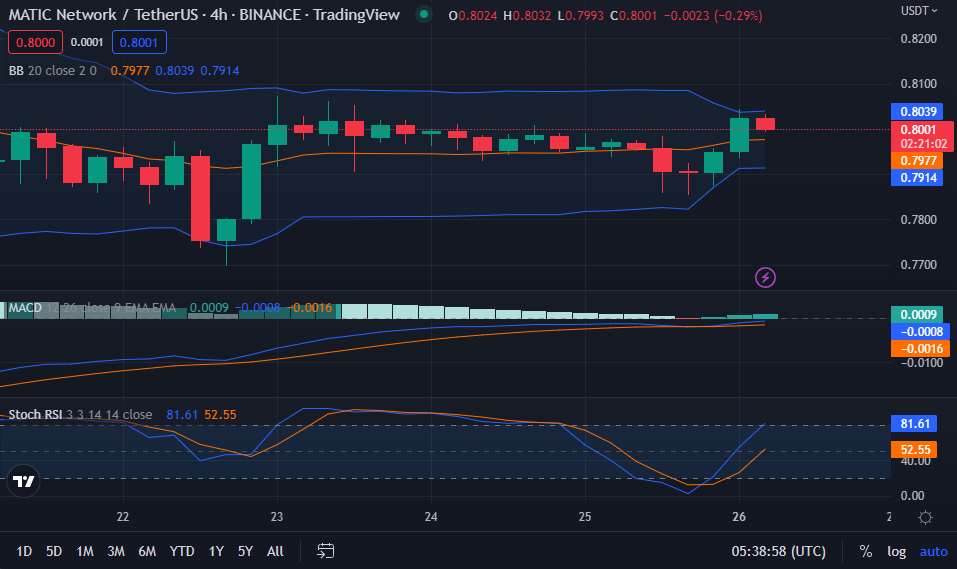
- MATIC’s price confronts resistance at $0.8037 during the uptrend.
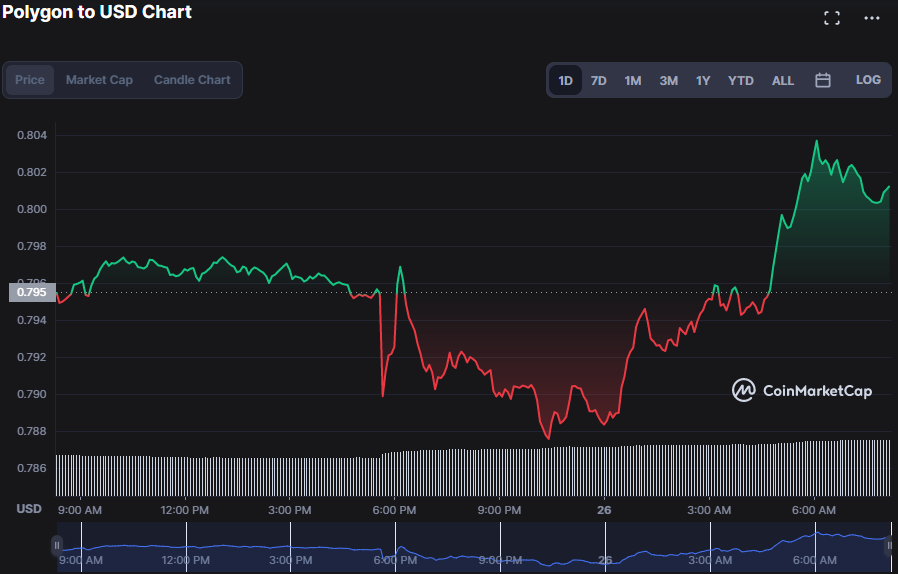
Today, bullish control has dominated the Polygon (MATIC) market, adding to the day’s strong trend as the holiday spirit takes hold. On the MATIC price chart, just a handful of negative spikes were visible, and they were enough to push prices down to $0.7876, where they eventually found support. However, at the time of writing, bulls had successfully taken power, driving MATIC’s price up to $0.8012.
By maintaining such commanding heights, MATIC had its market cap increase by 0.71%, to $6,997,620,802, and its 24-hour trading volume surge by 36.99%, to $129,231,526.
The linear movement of the upper (0.8039) and lower (0.7914) Bollinger Bands indicates that selling pressure is being met by purchasing pressure (a stable market) and may lead to a rise in bullish pressure. This positive trend is projected to strengthen as the price moves closer to the upper band, suggesting that the bulls will retain control in the near future.
Bulls’ hopes for a prolonged upswing are dimmed by the fact that the market is overbought (as indicated by a stochastic relative strength index value of 82.14). When the stochastic RSI hits the overbought zone, it indicates that the current bull run has reached its peak and is starting to fade.
When the MACD crosses above the signal line, as it has done at the present time (-0.007), it is indicative of a bullish continuation pattern. While the recent movement of the MACD line into the negative zone should cause caution among traders, the present upward trajectory of the histogram implies that this bullish trend will likely continue for the time being.
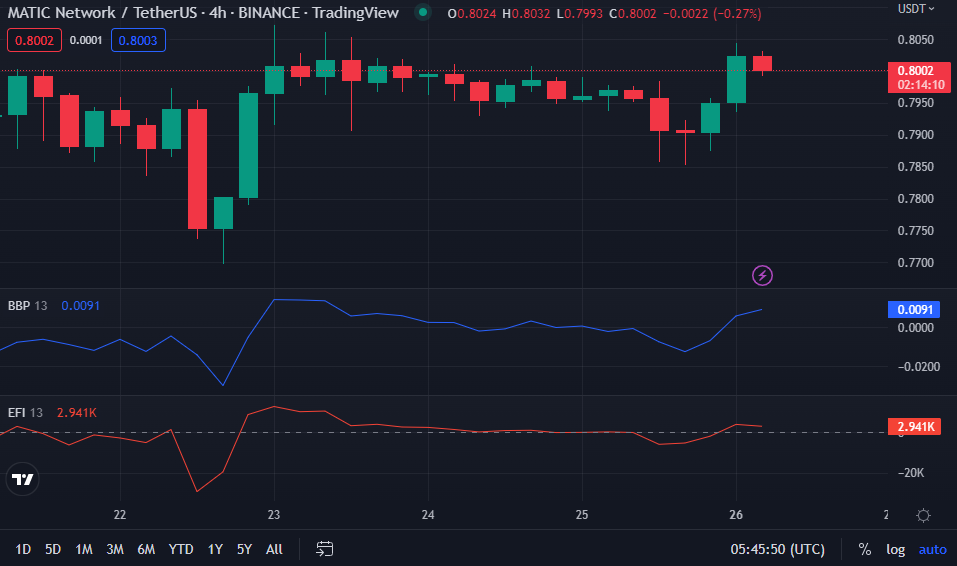
When both the Elder Force Index (EFI) and the Bull Bear Power (BBP) go below zero, it indicates a transition from bull to bear control. The MATIC price chart shows that the EFI has crossed the “0” line at 2.934K and that the BBP indicator has also begun to climb upward (now at 0.0091). With these numbers in hand, it’s evident that the bulls are still committed to riding out the current uptrend.
In conclusion, bullish strength is expected to prevail in the MATIC market, provided bulls maintain their current level of pressure.
Disclaimer: The views and opinions, as well as all the information shared in this price analysis, are published in good faith. Readers must do their own research and due diligence. Any action taken by the reader is strictly at their own risk, Coin Edition and its affiliates will not be held liable for any direct or indirect damage or loss.
Disclaimer: The information presented in this article is for informational and educational purposes only. The article does not constitute financial advice or advice of any kind. Coin Edition is not responsible for any losses incurred as a result of the utilization of content, products, or services mentioned. Readers are advised to exercise caution before taking any action related to the company.


