


, Chainlink (LINK) May Not Be Stopped by Pullbacks")
- Both LINK and ADA are enjoying a wave of whale interest.
- A strong support at $0.36 could help ADA ride all the way to $0.41.
- LINK’s bullish bias remains very potent, indicating a potential surge to $20.
In the last seven days, the prices of Cardano (ADA) and Chainlink (LINK) have increased, much to the delight of their holders. For example, LINK, trading at $15.03 at press time, has seen its value jump by 33.31% over the last week.
ADA, whose earlier days in the year, were plagued by massive nosedives, increased by 15.86% within the same period. Consequently, the price rise has brought back optimism into the market. However, according to on-chain data provider Santiment, the surge would have been impossible without the input of whales.
In Santiment’s post on X (formerly Twitter) on November 10, whale transactions involving LINK and ADA, valued at over $100,000, hit the highest point in the last six months
Typically, in the current market condition, these transactions are supposed to bring about a further price increase. Santiment agreed to the notion. But it also noted that there could be some profit-taking in the meantime before another uptick appears.
ADA to $0.41?
The 4-hour ADA/USD chart showed that buyers were currently present in the market. At the same time, there were sellers who were pushing to take profit acquired over the last seven days.
Therefore, it was necessary to ascertain which level ADA might hit after a wave of profit-taking. To do this, Coin Edition considered the Fibonacci retracement levels. At the time of writing, the 0.382 Fib level was around $0.36. This price level is a highly probable support for ADA.
So, there is a chance for ADA to resist selling pressure at $0.36. Should buying pressure re-appear, the 1.618 Fib level showed that ADA can hit $0.41. If the token does, $0.41 can also be the point where market players start to make a profit again.
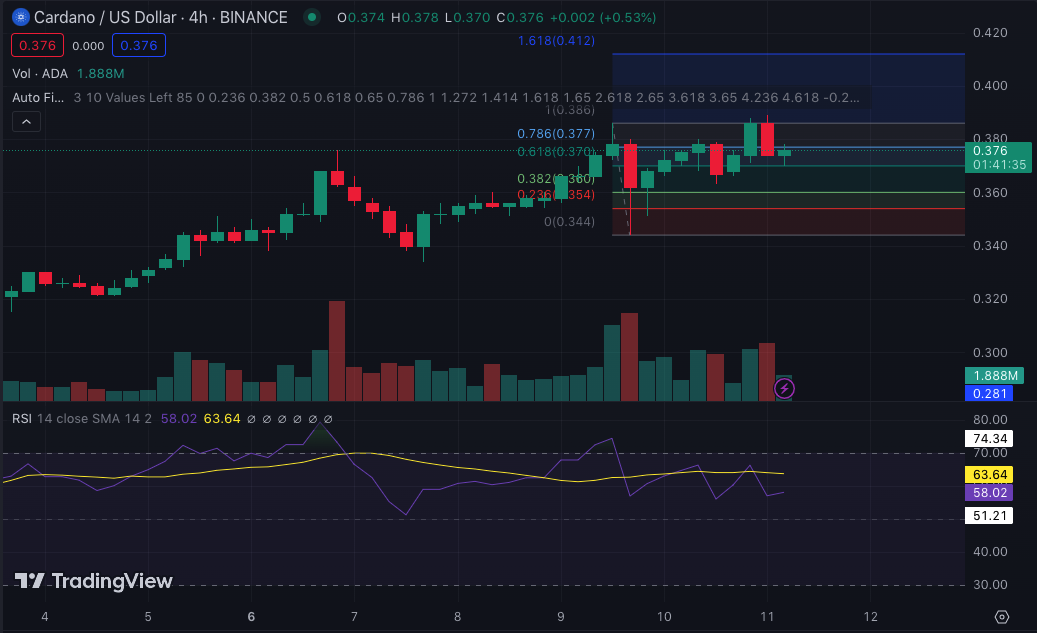
The Relative Strength Index (RSI) also fell to 58.02, meaning buying momentum was waning. If the RSI reading continues to decrease, then ADA may hit $0.36 before another round of uptick begins.
LINK Eyes $20
For LINK, the Directional Movement Index (DMI) showed that the bullish tendencies still remain strong. At the time of writing, the +DMI (green) was 29.43. The -DMI (red), on the other hand, was 11.84.
The large difference in the DMIs indicates that the potential of another LINK uptick was much more than a plunge. This inference was also supported by the Average Directional Index (ADX). The ADX, as of this writing, was 45.25.
Having an ADX reading above 25.00 means that LINK’s upward movement has strong backing. Furthermore, the Awesome Oscillator (AO) was 1.394. The positive value of the AO is considered a bullish signal.
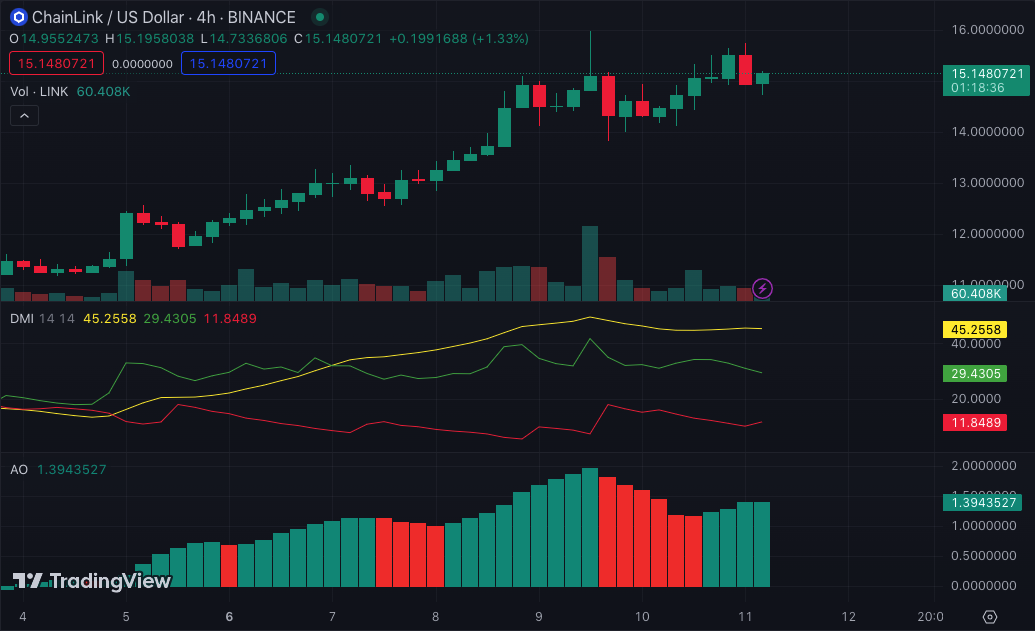
This implies that LINK has a lesser chance of retracing when compared to ADA. Should accumulation and whale interest continue to surge, then LINK might only be miles away from hitting $20.
Disclaimer: The information presented in this article is for informational and educational purposes only. The article does not constitute financial advice or advice of any kind. Coin Edition is not responsible for any losses incurred as a result of the utilization of content, products, or services mentioned. Readers are advised to exercise caution before taking any action related to the company.


