


- Cardano appears poised to break out of a symmetrical triangle.
- ADA has, however, remained within a Fibonacci resistance area.
- Coin accumulation persists among holders.
In a recent post on X, crypto analyst Dan Gambardello noted that the leading coin Cardano (ADA) might be poised for an upward breakout of a symmetrical triangle.
Gambardello assessed ADA’s price movements on a four-hour chart and noted that the coin’s formation of a symmetrical triangle mirrors a similar pattern observed in Solana’s (SOL) price a few weeks ago.
A symmetrical triangle is formed when an asset’s price bounces between converging upper and lower trendlines. This movement marks a period of uncertainty before a potential breakout in either direction.
According to Gambardello, should ADA successfully break out of the triangle in an uptrend to reach the $0.86 price target, it would mean a strong divergence from what was observed in the last market cycle.
Gambardello, however, warned that the coin’s price traded within the Fibonacci resistance area, and there lies a possibility that it fails to initiate an upward breakout of the already-formed symmetrical triangle.
When an asset trades within this resistance area, its price may face difficulty breaking through and could stall or move sideways for some time.
This typically happens because some market participants often choose to sell their holdings at these levels in anticipation of a reversal, while others are hesitant to buy due to the perceived resistance.
Where ADA Might Be Headed in the Short-Term
At the time of writing, ADA exchanged hands at $0.65, seeing a 10% price growth in the last 24 hours, according to data from CoinMarketCap.
Price movement observed on a weekly chart revealed that coin accumulation continues to grow among daily traders.
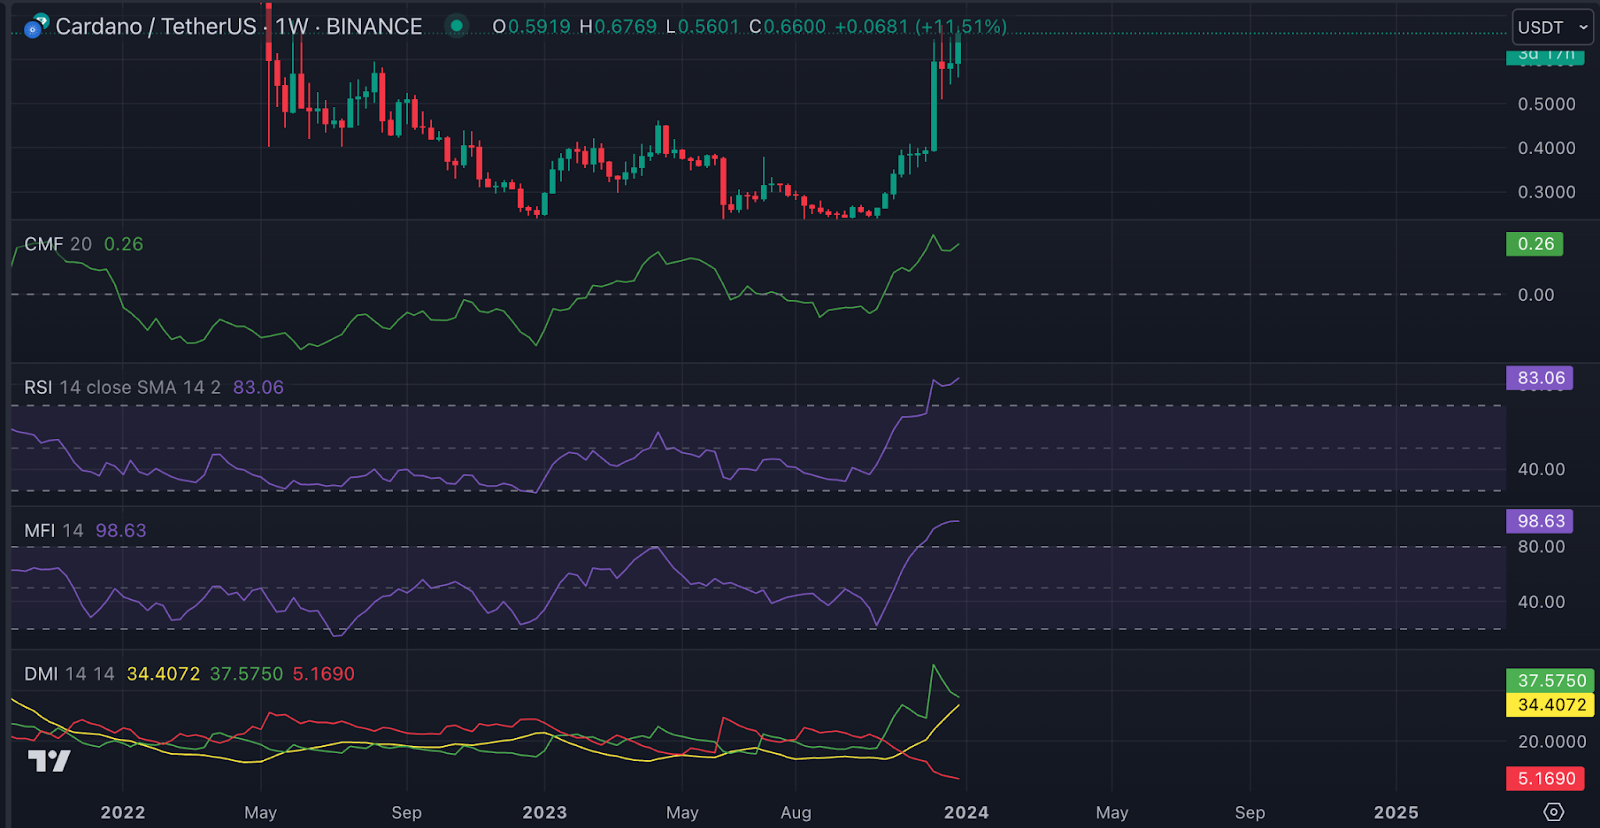
As of this writing, key momentum indicators were spotted at overbought highs. For example, ADA’s Relative Strength Index (RSI) was 83.06, while its Money Flow Index (MFI) was 98.63.
While these values showed increased coin accumulation, it is key to note that buyers might experience exhaustion at these levels; hence a slight price drawback might occur.
Notwithstanding, the coin’s Chaikin Money Flow (CMF) rested at 0.26 and remained in an uptrend at press time. This showed that the capital flow into the market remained high, increasing the possibility that the price hike would be sustained.
Confirming the strength of the current trend, ADA’s Average Directional Index (ADX) was 34.40. An ADX value above 30 suggests a clear and established trend with significant directional movement.
Disclaimer: The information presented in this article is for informational and educational purposes only. The article does not constitute financial advice or advice of any kind. Coin Edition is not responsible for any losses incurred as a result of the utilization of content, products, or services mentioned. Readers are advised to exercise caution before taking any action related to the company.


