



- CASHCAT has gained 14.53% in seven days, but resistance near $0.105 could limit further recovery.
- Open interest has stabilized at $41.05 million, signaling renewed participation after October’s decline.
- Positive exchange netflows suggest modest selling pressure as CASHCAT attempts to sustain its recovery.
Cash Cat (CASHCAT) is showing signs of recovery after weeks of declining prices, as buyers attempt to regain control. The token has gained 3.08% over the past 24 hours and 14.53% during the previous seven days.
CASHCAT currently trades around $0.1015, with a daily trading volume of approximately $16.82 million. Its market capitalization has reached $100.55 million, supported by a circulating supply of 990 million tokens.
CASHCAT Price Recovery Faces Important Resistance Levels
CASHCAT’s recent rebound follows an extended correction that began after the token reached approximately $0.31857. The subsequent decline established a pattern of lower highs and lower lows. This structure continues to reflect weakness across the daily timeframe.
Significantly, CASHCAT remains below its 20-day exponential moving average at $0.10497. Its 50-day and 100-day averages also stand higher, at $0.12364 and $0.12792, respectively. These indicators create several obstacles for buyers attempting to extend the recovery.
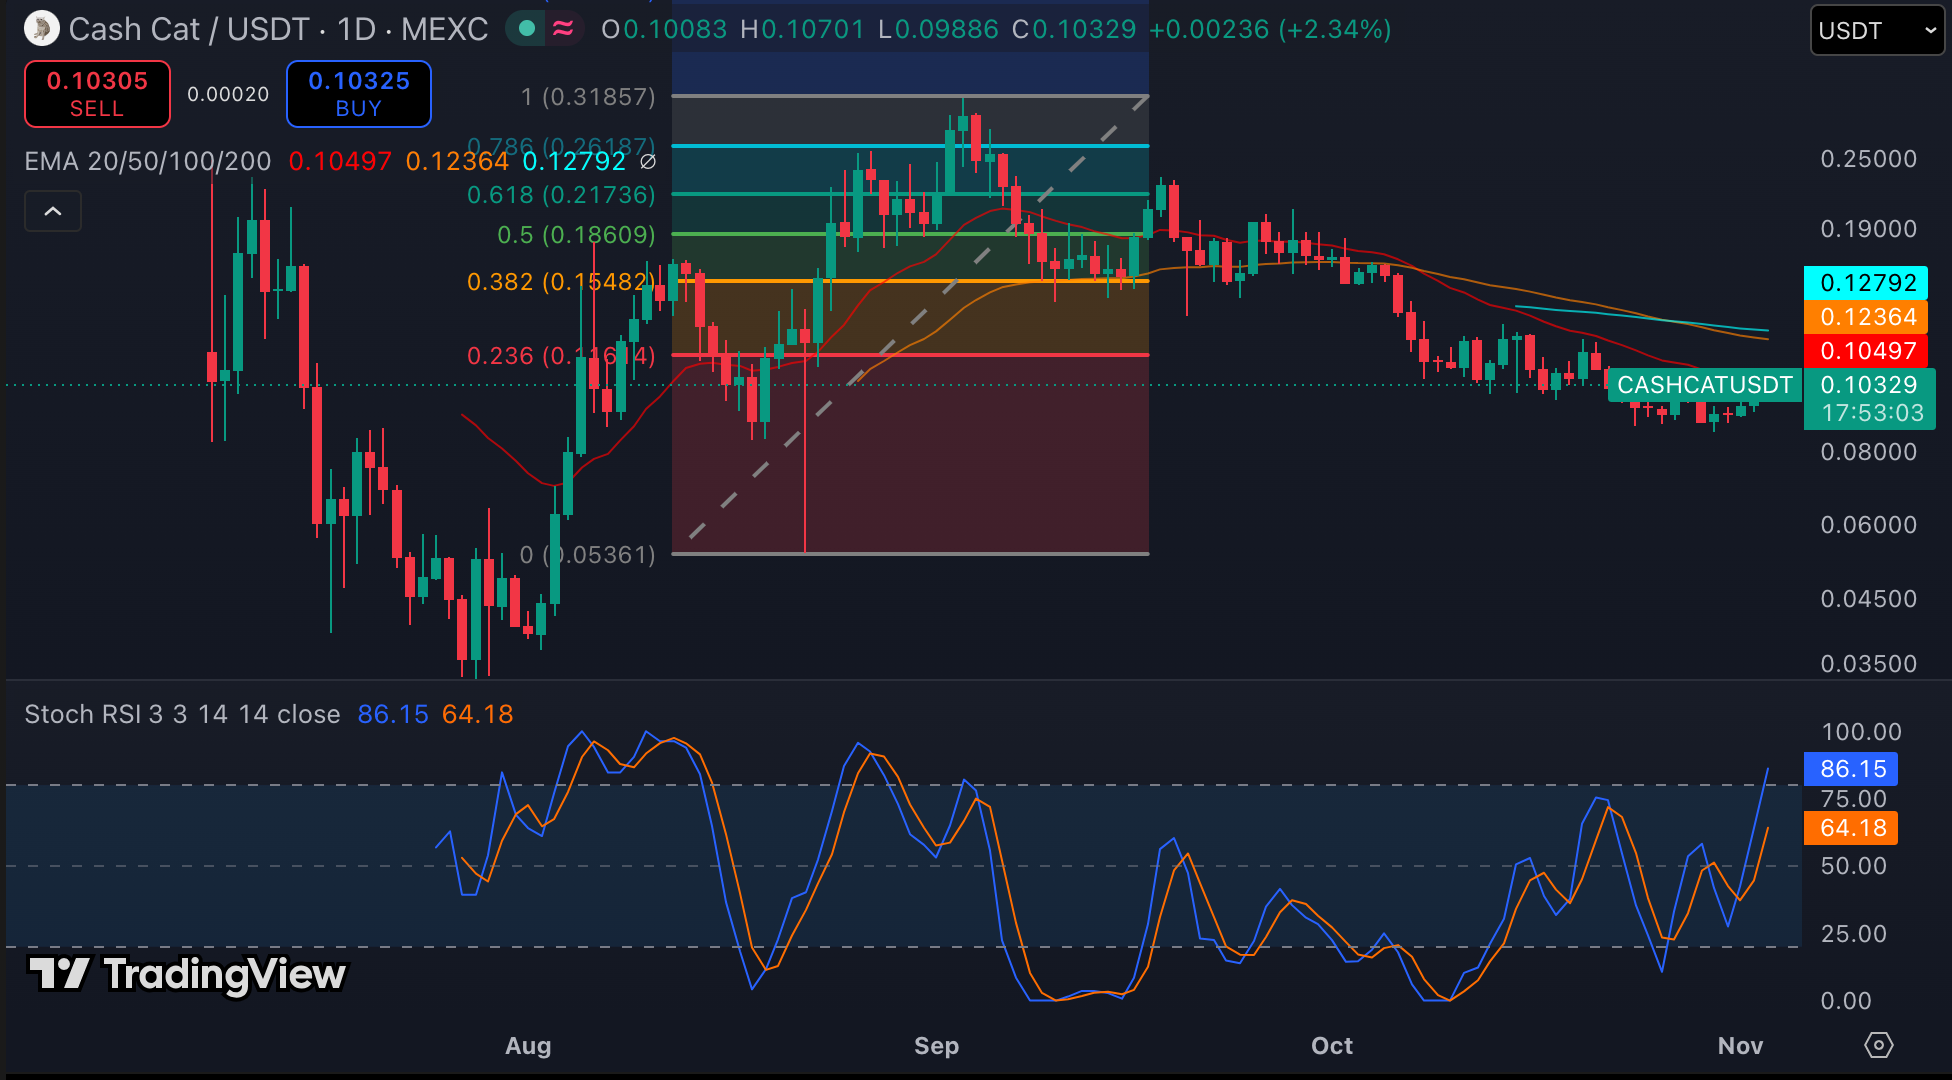
Moreover, the token previously lost the 0.236 Fibonacci retracement level at $0.11674. Reclaiming this threshold would represent an important improvement in market structure.
The Stochastic RSI currently stands at 86.15, while its signal line reaches 64.18. This reading indicates strong short-term momentum but also highlights overbought conditions. Consequently, traders could encounter temporary selling pressure before another upward attempt.
On the downside, $0.09886 provides immediate support. A deeper correction could expose $0.09000, followed by $0.08600. These levels could become important if buyers fail to defend the recent recovery.
Open Interest Shows Signs of Stabilization
CASHCAT’s derivatives market provides another perspective on the ongoing recovery. Open interest previously fluctuated between $60 million and $90 million during September. It eventually reached approximately $93 million toward the end of that month.
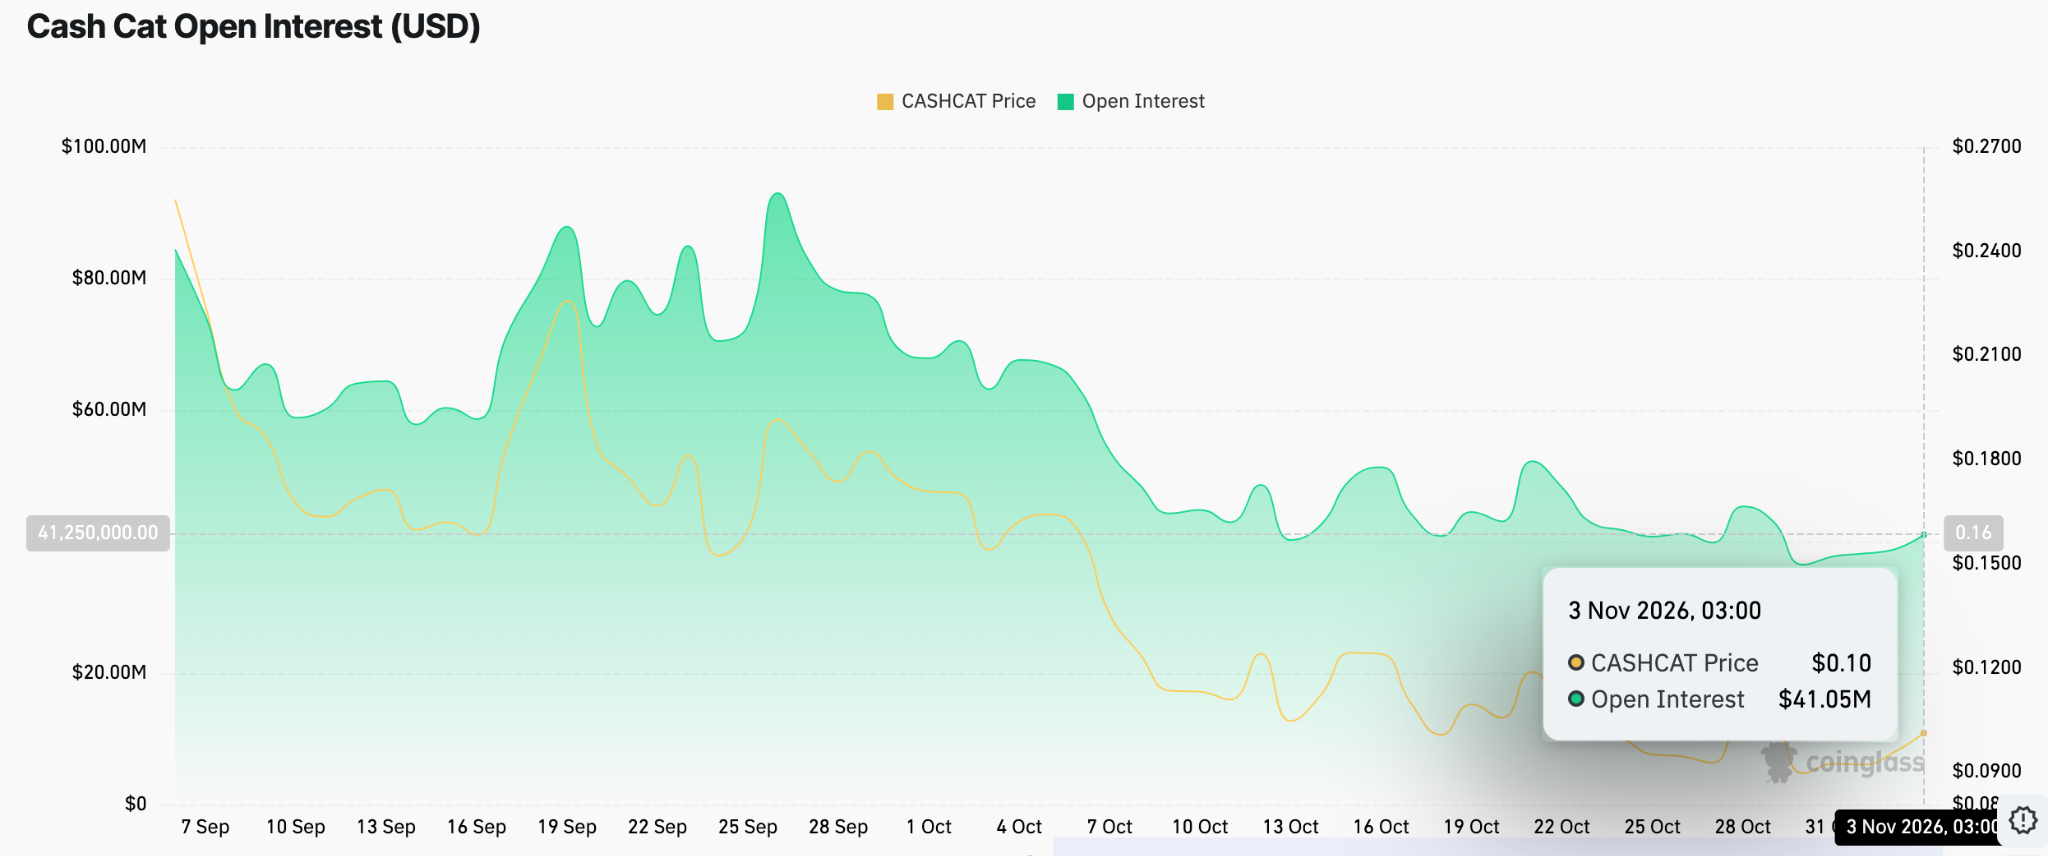
However, October brought a noticeable decline in speculative participation. Open interest dropped toward $40 million during mid-October before entering a relatively stable phase.
By November 3, the metric had recovered slightly to approximately $41.05 million. This movement suggests some traders have started rebuilding positions after reducing their exposure. Nevertheless, open interest remains considerably below September’s peak.
Exchange Flows Reveal Mixed Investor Behavior
Spot exchange flows also indicate changing investor behavior throughout CASHCAT’s recent correction. Data shows alternating inflows and outflows since early September, reflecting inconsistent buying and selling pressure.
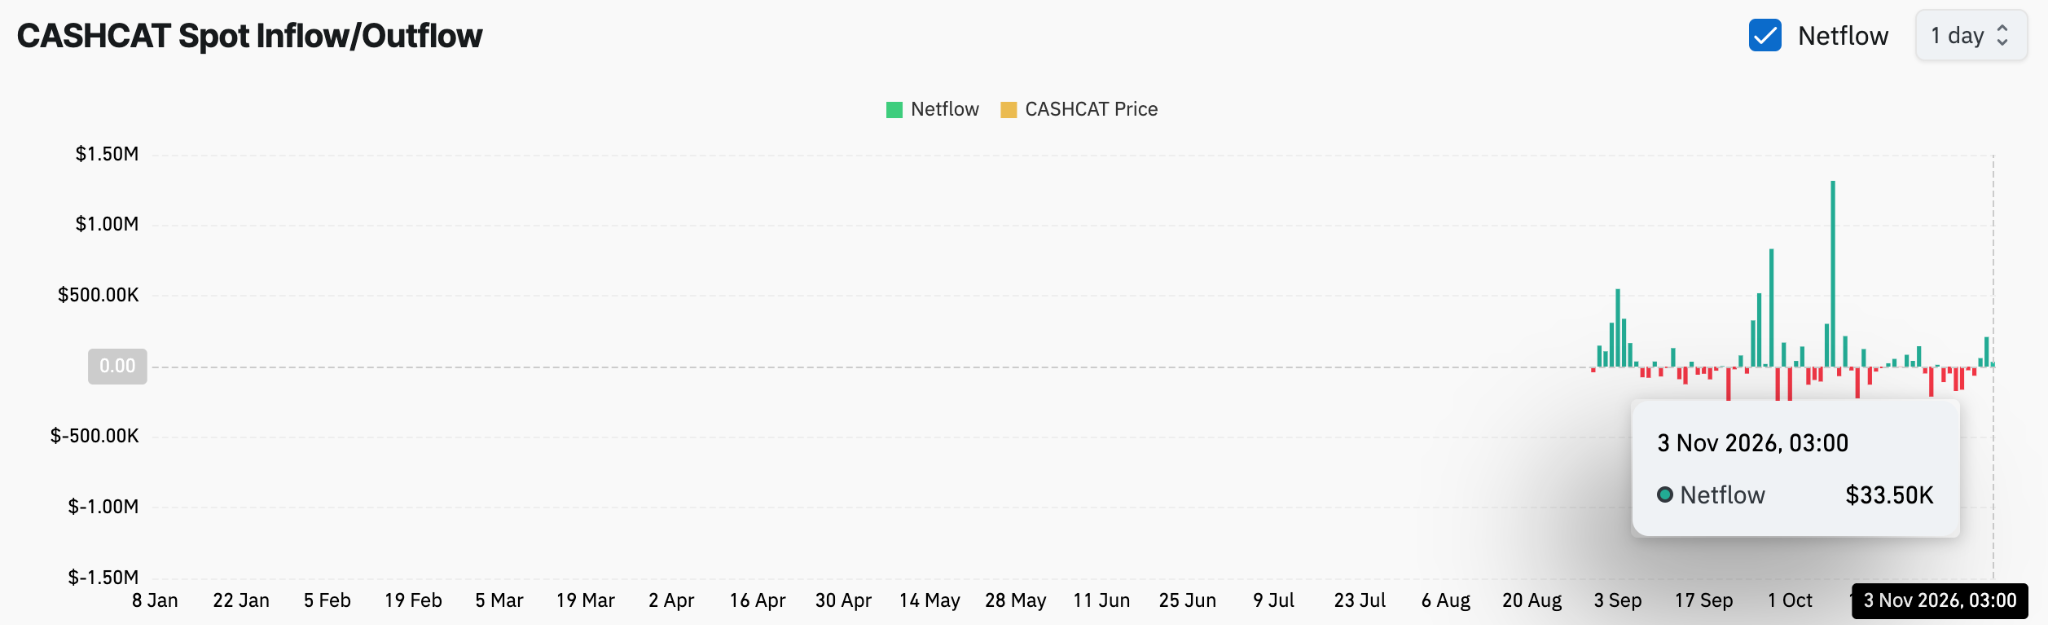
Several positive netflow spikes exceeded $500,000, with one movement approaching $1.3 million. These increases suggest periods of stronger token transfers onto exchanges. Such activity can introduce potential selling pressure when holders prepare to trade.
However, negative netflows appeared during other sessions, indicating withdrawals from exchanges. These movements may reflect accumulation or transfers into private wallets.
Related: Holo Price Prediction: HOT Breaks Downtrend as HoloFuel Launch Sparks Fresh Buying
On November 3, CASHCAT recorded a positive netflow of approximately $33,500. Although relatively modest, this movement suggests limited fresh inflow activity.
Technical Outlook for Cash Cat (CASHCAT)
Key levels remain well-defined as Cash Cat attempts to extend its short-term recovery:
Upside levels: $0.10497 (20-day EMA), $0.11674 (0.236 Fibonacci), and $0.12364 (50-day EMA) represent immediate resistance levels. A decisive breakout could extend toward $0.12792 (100-day EMA).
Downside levels: $0.09886 provides immediate support, followed by $0.09000 and $0.08600. Losing these levels could expose CASHCAT to further downside pressure.
Resistance ceiling: $0.12792 (100-day EMA) remains the key level to reclaim for stronger medium-term bullish momentum. The technical picture shows CASHCAT recovering from its October 30 low of $0.08615, although its broader daily structure remains bearish.
Will Cash Cat Go Up?
Cash Cat’s price prediction hinges on whether buyers can defend the $0.09886 support level and reclaim the $0.10497 resistance. Improving Stochastic RSI momentum and stabilizing open interest suggest renewed market participation. Additionally, the latest positive exchange netflow indicates modest capital returning to exchanges.
If bullish momentum strengthens, CASHCAT could challenge $0.11674 before targeting $0.12364 and $0.12792. However, failure to maintain support at $0.09886 risks exposing the token to $0.09000 and potentially $0.08600.
For now, CASHCAT remains at a critical turning point. Its recovery has gained momentum, but stronger buying pressure and a breakout above key moving averages remain necessary to confirm a sustained bullish reversal.
Disclaimer: The information presented in this article is for informational and educational purposes only. The article does not constitute financial advice or advice of any kind. Coin Edition is not responsible for any losses incurred as a result of the utilization of content, products, or services mentioned. Readers are advised to exercise caution before taking any action related to the company.