
- CFX price surges to 30-day high amid buyer dominance.
- Rising sentiment fuels CFX market capitalization and trading volume.
- Technicals hint at potential CFX uptrend continuation.
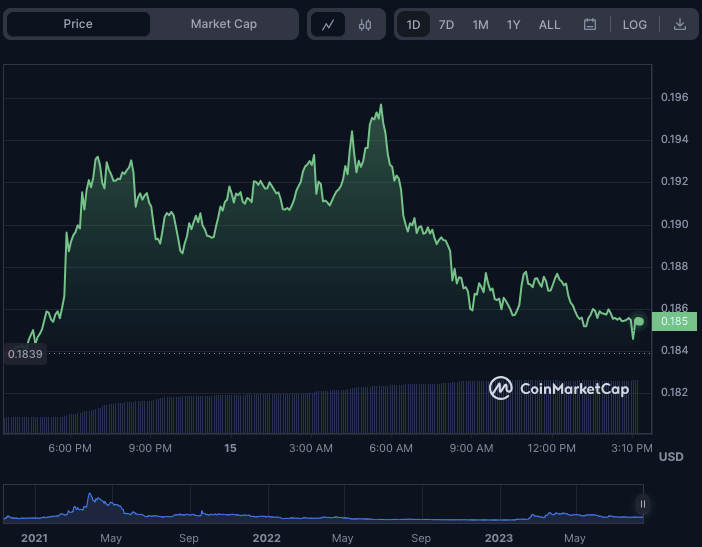
Conflux (CFX) buyers have outnumbered sellers over the last day, pushing the price from the day’s low of $0.1836 to a 30-day high of $0.1957. Despite this failure to breach resistance, CFX was trading at $0.1856 at the time of writing, up 1.02% from its intraday low.
CFX’s market capitalization and 24-hour trading volume increased by 1.12% and 219.53% to $587,735,854 and $57,239,318. The increase in market capitalization and trading volume may be attributed to the rising optimistic sentiment set by the 30-day high achieved by CRV bulls.
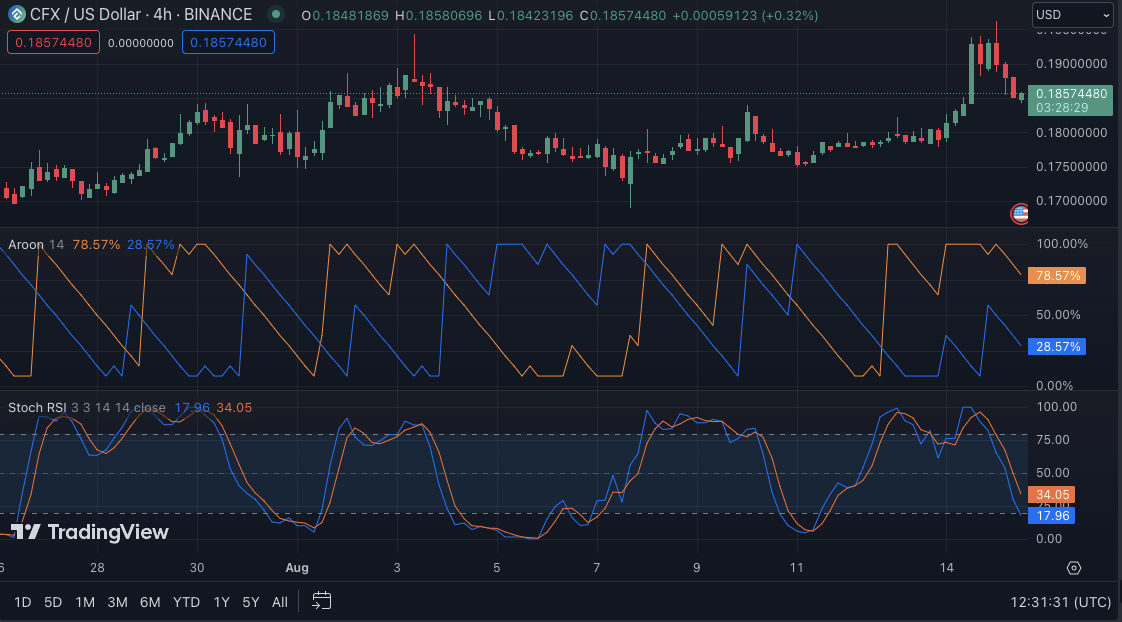
On the CFX/USD 4-hour price chart, the Aroon up (orange) is moving downhill with a reading of 78.57%, while the Aroon down (blue) is reading 28.57%. This shift suggests the CFX/USD upswing may be losing steam. Changing market sentiment from bullish to negative is indicated when the Aroon up line falls and the Aroon down line rises.
However, the stochastic RSI reading of 16.78 implies that the bullish momentum may still have some sway. A stochastic RSI value of less than 20 suggests that the CFX market may be oversold, which might lead to a reversal of the downtrend.
Based on the stochastic RSI’s suggestion of oversold circumstances, this reading shows that, despite the recent spike in the CFX price, there may still be an opportunity for additional upward movement.
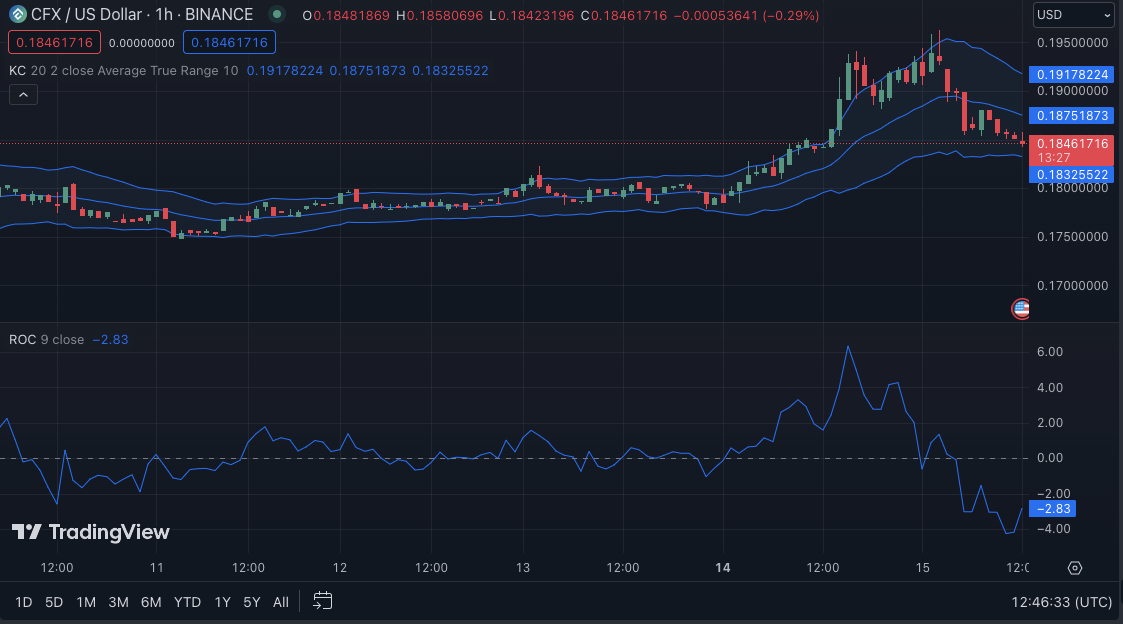
The Keltner Channel bands converge on the 1-hour price chart, with the top, middle, and lower bands touching at $0.19186181, $0.18545283, and $0.18333479, respectively. The shrinking Keltner Channel bands reflect reduced volatility, suggesting a likely consolidation period for the CFX market.
With the price action forming a green candlestick around the lower band, this might hint that buyers are jumping in at these levels, potentially driving the price higher. The rising volume during this consolidation phase supports this bullish signal, predicting a breakout.
Attempts by the Rate of Change (ROC) to climb over the -2.69 mark and exit the negative zone indicate a possible upward momentum change. If the ROC continues to rise and enters positive territory, it will support the possible upward breakout.
In conclusion, Conflux (CFX) shows signs of potential upward movement despite recent fluctuations, with technical indicators suggesting possible bullish momentum ahead.
Disclaimer: The views, opinions, and information shared in this price prediction are published in good faith. Readers must do their research and due diligence. Any action taken by the reader is strictly at their own risk. Coin Edition and its affiliates will not be liable for direct or indirect damage or loss.
Disclaimer: The information presented in this article is for informational and educational purposes only. The article does not constitute financial advice or advice of any kind. Coin Edition is not responsible for any losses incurred as a result of the utilization of content, products, or services mentioned. Readers are advised to exercise caution before taking any action related to the company.


