


 Bulls Face Resistance as Optimism Fades")
- Chainlink surges 61% weekly, riding the wave of positive crypto market sentiment.
- Bitcoin ETF anticipation boosts LINK’s market cap, but trading volume dips.
- LINK faces resistance at $11.4 and $12.00 after failing to break $11.26, while MFI signals potential selling pressure.
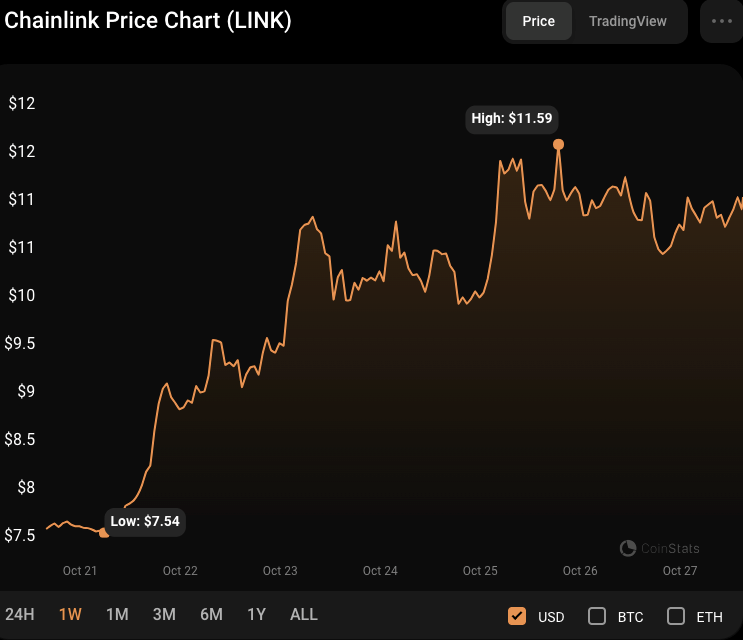
In the recent week, the Chainlink (LINK) market has shown bullish dominance, gaining more than 61% from an intra-week low of $7.54 to a high of $11.8 before seeing a modest retracement.
The current price increase in Chainlink may be linked to the general optimistic feeling in the crypto market over the past week, fueled by the expectation of Bitcoin ETFs hitting the market soon.
This event has resulted in a significant boost in the price of Bitcoin, which has benefited the broader market. Furthermore, the market capitalization of LINK increased by 1.73% to $6,178,888,812, but the 24-hour trading volume decreased by 3.61% to $768,131,501. Profit-taking by certain investors who have experienced substantial profits in the recent price spike might explain the drop in trading activity.
However, positive momentum has waned in the previous 24 hours, with LINK failing to break beyond the intraday high of $11.26. If the negative momentum breaks through the intraday low of $10.45, the next support level to monitor is around $10.00.
On the other hand, if the support level holds and the bullish trend continues, the following significant resistance levels are $11.4 and $12.00. These resistance levels may be challenging for LINK to overcome, as the recent price increase may have prompted traders to take profits and sell.
Conversely, if market sentiment stays favorable and demand for LINK is strong, it can break past these resistance levels and continue its upward trend.
LINK/USD Technical Analysis
On the LINK/USD price chart, the Keltner Channel bands are trending higher, indicating probable positive momentum in the market. With the upper, middle, and lower bands touching $11.79775, $10.73256, and $9.55275, respectively, this shows significant support and resistance at these price levels.
With green candlesticks emerging above the middle band, the price action reflects the bullish attitude, suggesting that buyers are in charge and driving the price upward. Furthermore, the tightening of the Keltner Channel bands indicates a reduction in volatility, which might contribute to a more consistent rising trend in the LINK/USD market.
However, the Money Flow Index (MFI) is going south with a score of 50.75, indicating that the market is under some selling pressure. This trend might restrict the price’s upward trajectory and soon result in a consolidation period.
If the MFI continues to decrease and goes below 50, it may suggest a change in market sentiment toward selling. This level could cause a temporary pullback or correction in the price of LINK/USD as sellers gain more control.
In conclusion, Chainlink’s recent bullish surge may face resistance, but its potential for further gains remains tied to market sentiment and Bitcoin ETF developments.
Disclaimer: The information presented in this article is for informational and educational purposes only. The article does not constitute financial advice or advice of any kind. Coin Edition is not responsible for any losses incurred as a result of the utilization of content, products, or services mentioned. Readers are advised to exercise caution before taking any action related to the company.


