- Bullish LINK price prediction for 2026 ranges from $15 to $25.
- LINK could hit $25 in 2026 if DTCC production trades scale toward October’s full launch and exchange outflows keep compounding.
- The bearish LINK price prediction for 2026 is $6.50.
Chainlink’s institutional footprint is expanding faster than LINK’s price. DTCC is using its infrastructure for tokenized securities and 24/7 collateral management, while 50 banks are tapping it for FX settlement. Yet LINK trades at $8.30, 84% below its record high, with technicals pointing to $7.40. This LINK price prediction examines whether adoption can finally close that gap.
Table of contents
- What Is Chainlink (LINK)?
- Chainlink (LINK) Current Market Status
- Chainlink (LINK) Price Prediction 2026-2050 Overview
- Chainlink (LINK) Price Prediction 2026
- Chainlink (LINK) 2026 Fundamental Catalysts
- Chainlink (LINK) Price Prediction 2027: First Year of Full DTCC and Pangea Production Data
- Chainlink (LINK) Price Prediction 2028: Bitcoin Halving Cycle and RWA Market Share
- Chainlink (LINK) Price Prediction 2029: Post-Halving Peak and Enterprise Track Records Become Visible
- Chainlink (LINK) Price Prediction 2030: The $16 Trillion RWA Market Question
- Chainlink (LINK) Price Prediction 2031: Post-Cycle Compression and the Reserve Floor
- Chainlink (LINK) Price Prediction 2040: Foundational Infrastructure or Commoditized Layer?
- Chainlink (LINK) Price Prediction 2050: The SWIFT of On-Chain Finance
- Conclusion
- Frequently Asked Questions (FAQs)
What Is Chainlink (LINK)?
Chainlink is the industry-standard oracle network, solving the fundamental problem that blockchains cannot natively access external data — prices, real-world events, and cross-chain messages. Founded in 2017, its decentralized node operators source and deliver that data on-chain, staking LINK as collateral against dishonest reporting.
| Product | Function |
| Data Feeds | Secures the majority of DeFi TVL across Aave, Synthetix, Compound, and hundreds of others |
| CCIP | Cross-chain messaging — $7B+ in token migrations in Q2 2026, up 353% year-over-year |
| VRF | Verifiable randomness for gaming and NFTs |
| Automation | Decentralized contract execution for smart contract triggers |
| Proof of Reserve | Real-time verification that tokenized assets are backed by their claimed collateral |
The Chainlink Reserve is the structural mechanism worth understanding. Off-chain and on-chain enterprise revenue converts to LINK and accumulates in a strategic reserve, meaning every enterprise customer paying for Chainlink services indirectly contributes to LINK being bought and held.
Chainlink (LINK) Current Market Status
| Metric | Value |
| Price (July 27, 2026) | ~$8.30 |
| All-Time High | $52.70 to $52.99 (May 10, 2021) |
| ATH to Current | -84% |
| Market Capitalization | ~$5.3B to $6.4B |
| CMC Rank | #14 to #17 |
| Circulating Supply | ~748M LINK (~75% of max) |
| Max Supply | 1,000,000,000 LINK |
| 50-Day MA | $8.75 (price below) |
| 200-Day MA | $9.30 to $9.34 (price below) |
| RSI | 44 |
| CCIP Q2 2026 Volume | $7B+ (+353% YoY) |
| Secured Value | $93B+ |
| Combined ETF Net Inflows | $124.51M |
Chainlink (LINK) Price Prediction 2026-2050 Overview
| Year | Bearish | Base | Bullish |
| 2026 | $6.50 to $8 | $9 to $14 | $15 to $25 |
| 2027 | $7 to $12 | $14 to $30 | $35 to $55 |
| 2028 | $10 to $18 | $20 to $45 | $50 to $90 |
| 2029 | $15–$28 | $35–$70 | $80–$140 |
| 2030 | $18 to $35 | $45 to $90 | $100 to $200 |
| 2031 | $15 to $30 | $35 to $75 | $90 to $160 |
| 2040 | $30 to $70 | $100 to $250 | $300 to $500 |
| 2050 | $40 to $90 | $150 to $400 | $450 to $1,000+ |
Chainlink (LINK) Price Prediction 2026
LINK fell 4.8% from a July 21 high of $8.75 to $8.33 on July 24 on volume of $146 to $150 million, breaking the rising trendline that had defined the prior weeks’ structure. The token now trades below both the 50-day MA at $8.75 and the 200-day MA at $9.30. CryptoPatel’s short setup published July 25 defines the near-term map: entry $8.38 to $8.48, stop $8.58, targets at $7.87, $7.67, and $7.40, with $7.67 as the Fibonacci confluence zone and the most technically relevant downside target.
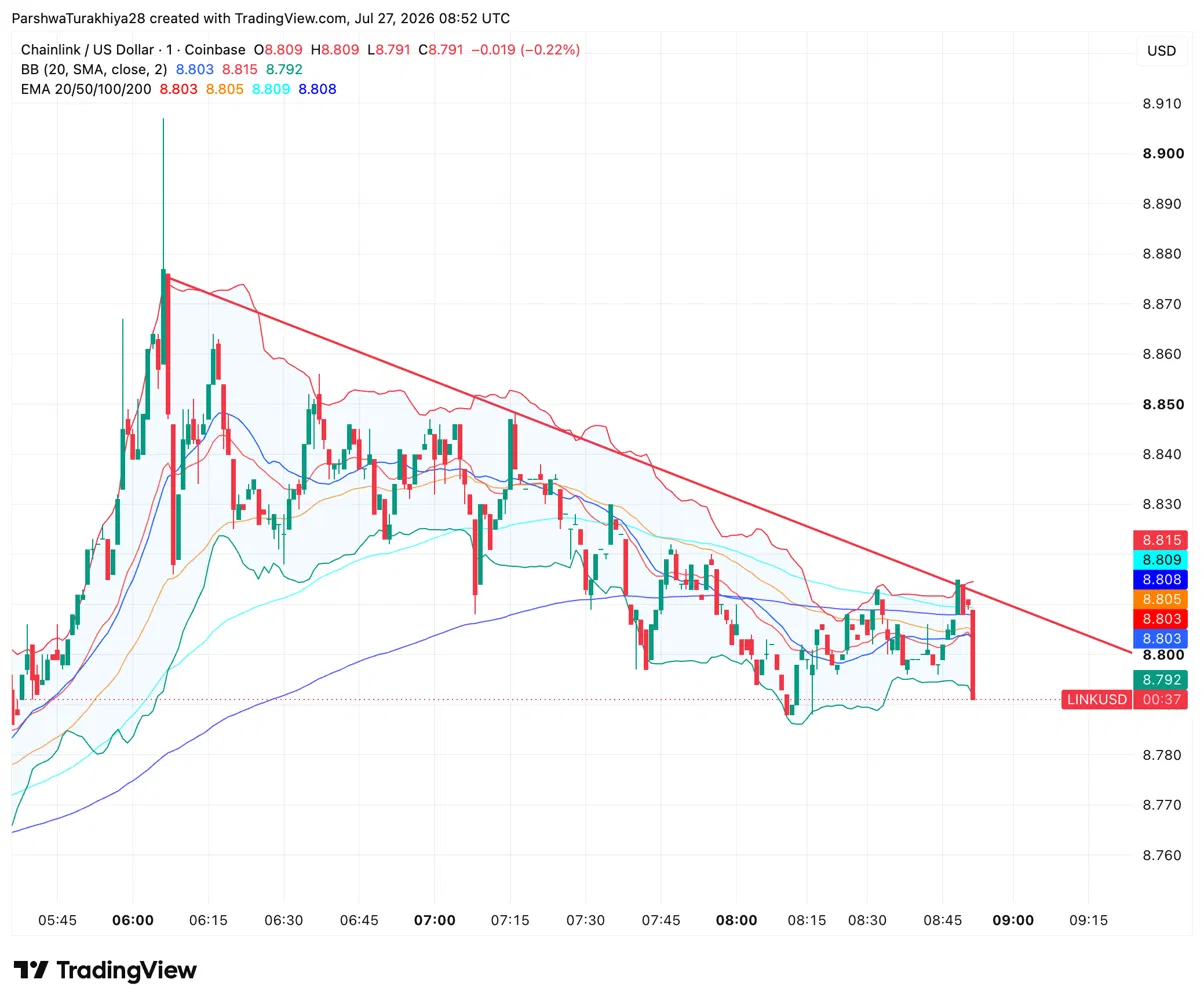
LINK/USD Daily Chart (Source: TradingView)
RSI at 44 is weak but not oversold, leaving room for further downside before any exhaustion signal forms. Reclaiming the 200-day SMA at $9.30 is the minimum requirement to flip the medium-term structure back to bullish.
The exchange outflow data tells a different story. Over 15.7 million LINK left exchanges in a month, a 12% supply drop. Ali Martinez tracked 3.9 million LINK worth approximately $32.6M moved from Coinbase Prime to a previously inactive wallet, and a separate 1.58 million LINK accumulated via Binance transfers into a single address, both consistent with institutional custody or staking. Non-empty Ethereum wallets hit an all-time high near 900,000. Bearish trendline structure sitting on top of the strongest accumulation signals in the token’s history is the complete LINK picture right now.
Key LINK levels for 2026:
- Resistance: $8.58 (short stop), $8.75 (50-day MA), $9.30 (200-day MA), $10.00
- Support: $8.20 to $8.35 (defense zone), $7.87, $7.67 (Fibonacci), $7.40, $7.19 (July 1 low)
Chainlink (LINK) 2026 Fundamental Catalysts
Two Concurrent Independent DTCC Deployments
| DTCC Deployment | Date | Go-Live Target | Partners |
| Tokenized Securities Production Trades | July 15, 2026 (first live trades) | October 2026 (full commercial) | BlackRock, Vanguard, Goldman Sachs, JPMorgan, 30+ firms |
| 24/7 Collateral Management System (Runtime Environment) | May 2026 (selection announced) | Q4 2026 (production) | DTCC internal deployment |
Two separate DTCC production deployments converging in the same Q4 2026 window is a depth of institutional integration no other oracle competitor has matched.
Project Pangea: 50+ Bank FX Settlement Consortium
More than fifty banks across sixteen countries are working to settle FX trades in near-real-time rather than the standard two-day settlement window. Global FX markets trade trillions daily. Even a small fraction moving toward Chainlink-verified settlement represents an addressable market most crypto assets never access.
Two Spot ETFs Already Functioning
Grayscale’s GLNK and Bitwise’s CLNK trade on NYSE Arca with combined net inflows of $124.51M, holding 1.72% of circulating supply between them. July 1 alone added $915K in inflows. Fund flows are accumulating capital even while price lags, a genuine divergence between institutional demand and spot price that several analysts have flagged directly.
Nazarov’s Decoupling Thesis
Co-founder Sergey Nazarov’s central 2026 argument is that the RWA, TradFi tokenization, and digital assets industry has now decoupled from crypto prices as a determining factor of its success. His claim that the world is approximately 30% of the way to global on-chain adoption frames LINK’s institutional integration as early-stage relative to where it is heading rather than a completed re-rating.
The Honest Structural Risk
The persistent bear case is not a single event but a pattern repeated across nearly every 2026 news cycle: genuine institutional adoption has not translated into proportional LINK price appreciation. LINK’s value capture mechanism through staking, fees, and Reserve accumulation is more indirect than tokens with explicit fee-switch or buyback models. LINK powered World Cup 2026 betting infrastructure and still traded near 90-day lows at the time. Whether that gap is a market inefficiency waiting to correct or a structural feature of how LINK’s tokenomics were designed is the single question every price target below depends on.
LINK Price Prediction 2026:
| Scenario | Price Range |
| Bullish | $15 to $25 |
| Average | $9 to $14 |
| Bearish | $6.50 to $8 |
Chainlink (LINK) Price Prediction 2027: First Year of Full DTCC and Pangea Production Data
By 2027, both major DTCC initiatives including the tokenization service and collateral management system will be in full production for over a year, and Project Pangea’s bank consortium should show measurable FX settlement volume. This is the year the market gets its clearest evidence yet of whether institutional adoption translates to LINK demand at scale.
Michaël van de Poppe named LINK specifically as one of the altcoins with the strongest fundamental-to-price divergence in the current market, comparing the current institutional-adoption-outpacing-retail-participation setup to early 2019 and mid-2020, both of which preceded substantial LINK rallies. If that historical pattern repeats with DTCC and Pangea volumes visibly scaling, 2027 is when it would show up in price.
| Scenario | Price Range |
| Bullish | $35 to $55 |
| Average | $14 to $30 |
| Bearish | $7 to $12 |
Chainlink (LINK) Price Prediction 2028: Bitcoin Halving Cycle and RWA Market Share
The April 2028 Bitcoin halving historically drives the broadest altcoin expansion of each four-year cycle. By 2028, if Chainlink’s tokenized RWA infrastructure has captured meaningful share of what BCG projects as a multi-trillion-dollar market, LINK’s institutional positioning, arguably the deepest of any oracle or infrastructure token in crypto, should be reflected more clearly in price than it has been through 2026. The bear case assumes the value-capture gap Nazarov describes as decoupling proves structurally permanent rather than temporary, with enterprise adoption continuing to outpace token demand indefinitely.
| Scenario | Price Range |
| Bullish | $50 to $90 |
| Average | $20 to $45 |
| Bearish | $10 to $18 |
Chainlink (LINK) Price Prediction 2029: Post-Halving Peak and Enterprise Track Records Become Visible
Post-halving cycle peak conditions historically benefit large-cap, institutionally-validated infrastructure tokens most. By 2029, Chainlink’s enterprise partnership stack — DTCC, UBS, ANZ, JPMorgan, Euroclear, and the 50-bank Pangea consortium — will have multi-year production track records behind them, the strongest possible evidence base for institutional-grade infrastructure claims.
If Project Pangea’s FX settlement volume has scaled meaningfully and both DTCC deployments — the tokenized securities service and the 24/7 collateral management system — show sustained usage, 2029 is the year the Chainlink Reserve’s accumulated enterprise revenue becomes visible and material on-chain. The transition from adoption narrative to on-chain evidence is what separates 2029 from every prior year in this forecast.
The bear case assumes the value-capture gap persists even with years of production evidence, reinforcing the argument that the disconnect between institutional adoption and token price is structural rather than a temporary mispricing that resolves over time.
| Scenario | Price Range |
| Bullish | $80.00 to $140.00 |
| Average | $35.00 to $70.00 |
| Bearish | $15.00 to $28.00 |
Chainlink (LINK) Price Prediction 2030: The $16 Trillion RWA Market Question
The 2030 case centers on one question: has the tokenized RWA market reached BCG’s projected $16 trillion scale, and has Chainlink captured a durable, defensible share of the oracle and interoperability infrastructure underneath it?
LINK’s position at nine times the secured value of the next-largest oracle competitor is the strongest argument for genuine infrastructure pricing power if that market materializes. The bear case assumes competing oracle providers or proprietary in-house data infrastructure from major tokenization platforms erode Chainlink’s dominant position before enterprise adoption converts to proportional token value.
| Scenario | Price Range |
| Bullish | $100 to $200 |
| Average | $45 to $90 |
| Bearish | $18 to $35 |
Chainlink (LINK) Price Prediction 2031: Post-Cycle Compression and the Reserve Floor
Post-cycle compression follows every crypto bull run, and LINK’s own history — an 84% drawdown from its 2021 peak persisting for five years — demonstrates how long and severe these corrections can run.
The differentiator for 2031 is the Chainlink Reserve mechanism. If DTCC’s dual deployments and Project Pangea are generating real, multi-year production revenue by then, the Reserve provides a floor tied to enterprise fee revenue rather than pure speculative sentiment — a distinction most infrastructure tokens without a comparable mechanism do not have.
| Scenario | Price Range |
| Bullish | $90 to $160 |
| Average | $35 to $75 |
| Bearish | $15 to $30 |
Chainlink (LINK) Price Prediction 2040: Foundational Infrastructure or Commoditized Layer?
By 2040, if the tokenized global financial system thesis plays out, Chainlink’s position as the connective infrastructure layer between on-chain and off-chain systems becomes increasingly foundational rather than optional. The width of the price spread reflects genuine uncertainty about whether oracle infrastructure remains a distinct, valuable category or gets absorbed into broader blockchain platform functionality over 14 years.
| Scenario | Price Range |
| Bullish | $300 to $500 |
| Average | $100 to $250 |
| Bearish | $30 to $70 |
Chainlink (LINK) Price Prediction 2050: The SWIFT of On-Chain Finance
At 33 years old by 2050, Chainlink would be legacy infrastructure if the current trajectory holds — the closest crypto analogue to SWIFT’s role in traditional finance but for on-chain and cross-chain data and settlement. The bull case requires Nazarov’s thesis that RWAs could surpass cryptocurrencies in total value to be broadly correct, and for Chainlink specifically to remain the default compatibility layer banks choose over building proprietary alternatives across three decades.
| Scenario | Price Range |
| Bullish | $450 to $1,000+ |
| Average | $150 to $400 |
| Bearish | $40 to $90 |
Conclusion
Chainlink presents the widest gap between institutional validation and token price of any asset in this series. Two independent DTCC production deployments, a 50-bank FX settlement consortium, two live spot ETFs with $124.51M in net inflows, $93 billion in secured value at nine times the nearest competitor, and exchange outflows pushing non-empty wallets to an all-time high are all sitting beneath a token that broke its trendline, trades under both major moving averages, and has an active short setup targeting $7.40.
Whether $25 arrives in 2026 or $9.30 does not get reclaimed at all depends on one specific and testable event: does the October 2026 DTCC full-service launch and Q4 collateral management go-live produce visible, on-chain evidence that institutional volume is finally converting to LINK demand. Until that evidence prints, the chart and the fundamentals will keep telling two different stories.
Frequently Asked Questions (FAQs)
At $8.30, $25 requires a 3x move while the near-term chart is working against it. LINK broke its rising trendline, trades below both the 50-day MA at $8.75 and 200-day MA at $9.30, and has an active short setup targeting $7.40. $25 as a 2026 bull case requires reclaiming $9.30 first, then a sustained rally driven by visible scaling of DTCC production volume through October’s full launch. Real 2026 scenario — but needs the technical structure to flip first.
Bearish: $6.50 to $8. Base case: $9 to $14. Bullish: $15 to $25. The bull case requires reclaiming the 200-day MA at $9.30 and visible evidence of DTCC production volume scaling toward October’s full commercial launch. The bear case reflects the CryptoPatel short targets: $7.87, $7.67 (Fibonacci confluence), and $7.40.
Bearish: $18 to $35. Base case: $45 to $90. Bullish: $100 to $200. The bull case depends on Chainlink capturing a durable share of BCG’s projected $16 trillion tokenized RWA market by 2030, with $93B in currently secured value at nine times the next-largest oracle competitor as the structural foundation.
Bearish: $40 to $90. Base case: $150 to $400. Bullish: $450 to $1,000+. The bull case requires Nazarov’s RWA-surpassing-crypto thesis to be broadly correct and Chainlink to remain the default on-chain to off-chain compatibility layer over three decades.
They are separate and independent. First: DTCC ran live production trades of tokenized securities on July 15, 2026 with Chainlink in the stack alongside BlackRock, Vanguard, Goldman Sachs, and JPMorgan — full commercial service targets October 2026. Second: DTCC selected Chainlink’s Runtime Environment in May 2026 to power a new 24/7 collateral management system targeting Q4 2026 production. Two concurrent, independent production deployments with the same institution is a depth of integration no oracle competitor currently matches.
LINK fell 4.8% from $8.75 to $8.33 on volume of $146 to $150 million — enough to confirm a trendline break with seller conviction. CryptoPatel published a full short setup the following day targeting $7.87, $7.67 (Fibonacci), and $7.40. This happened despite the DTCC production trades news from July 15, illustrating the persistent fundamentals-versus-price disconnect that defines LINK’s 2026 story.
The Chainlink Reserve converts off-chain and on-chain enterprise revenue to LINK tokens that accumulate in a strategic reserve. Every enterprise customer paying for Chainlink services indirectly contributes to LINK being bought and held. It provides a structural value-capture mechanism tied to enterprise revenue rather than speculative sentiment, though less immediate than a direct fee-switch or buyback model.
LINK has the deepest institutional integration of any oracle asset: two independent DTCC production deployments, a 50-bank FX consortium across 16 countries, two live spot ETFs with $124.51M in combined net inflows, and $93B in secured value at nine times the next competitor. It also has the widest, most persistent gap between that adoption and token price. Whether that gap is a market inefficiency about to correct or a structural feature of LINK’s indirect value-capture is the single question every price target depends on.
Disclaimer: The information presented in this article is for informational and educational purposes only. The article does not constitute financial advice or advice of any kind. Coin Edition is not responsible for any losses incurred as a result of the utilization of content, products, or services mentioned. Readers are advised to exercise caution before taking any action related to the company.