


 Sets Its Eyes on Another Jump: Is $20 Possible?")
- LINK may be set to hit another high but the price might fall for before the hike.
- The token might drop to $14.78 where the $0.618 Fib level was.
- Open Interest increased, suggesting possible strength for the price to hit $20.
Chainlink’s (LINK) price might be ready for another climb as another round of its non-circulating supply hits the market, Lookonchain disclosed. According to the on-chain tracking platform, 15.95 million LINK was sent into Binance.
This transaction is something Chainlink does every three months, and a total of 95.95 million tokens have been sent since August 2022. Lookonchain also noted that each time this transfer happens, LINK’s price usually increases.
LINK Got Overbought
At press time, LINK’s price was $17.73, representing a 25.59% increase in the last seven days. Furthermore, a look through CoinMarketCap showed that LINK was the highest out of all the top altcoins within the aforementioned period.
As of this writing, the 4-hour LINK/USD chart showed that the token had attempted to hit $19 earlier. But it was followed by a quick rejection which triggered a drop from $18.86. Meanwhile, hitting $18.86 meant that LINK hit its highest value in the last 22 months.
Details from the chart below also showed that LINK’s trading volume was high. Should the volume remain at a similar peak, the price action might try and retest $18 for a start.
An assessment of the Relative Strength Index (RSI) showed that the reading hit 80.81 on February 2. This earlier hike implied that LINK was overbought, after which the RSI declined.
The decline in the RSI and profit-taking seemed responsible for the LINK’s retracement. Should the reading fall below 60.00, LINK’s price might also continue in the downward direction. If profit-taking continues, there is a chance the token value might fall below $15.
New Entries and a Surging Interest
Also, indications from the Fibonacci retracement showed that the possible decline could offer another buying opportunity around $14.78. This was because the 0.618 Fib level was positioned at this price.
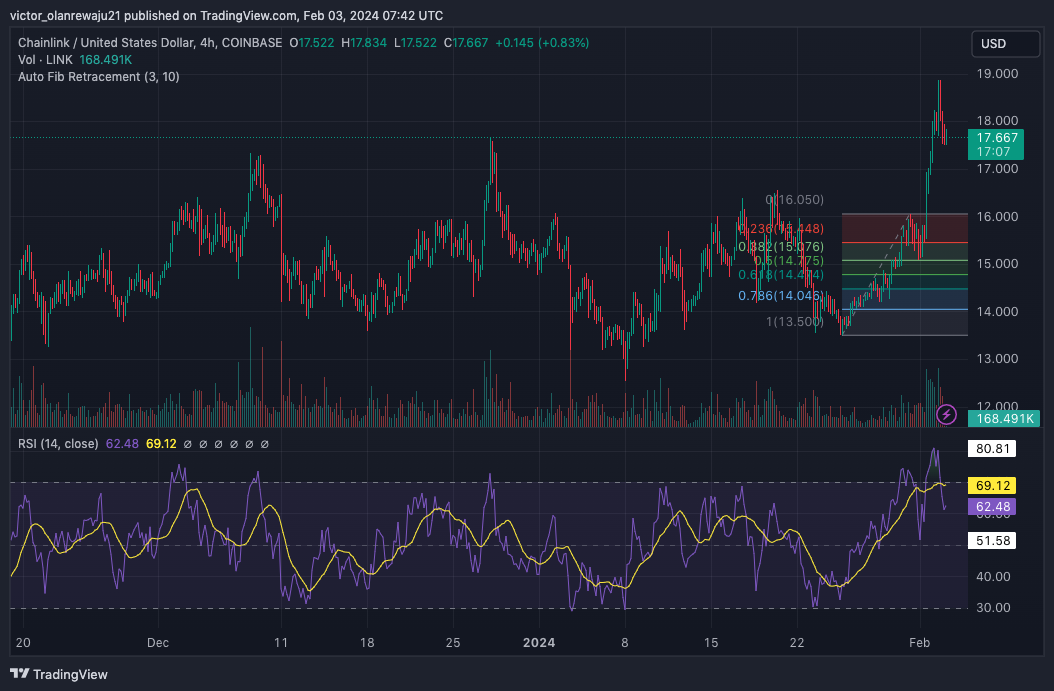
In a highly bearish case, LINK’s price might hit the 0.618 Fib retracement level. However, if the price recovers before then, LINK might hit $20 in a few weeks.
On the derivatives end of the market, Coinglass showed that LINK’s Open Interest jumped to $364.11 million. Open Interest is the sum of all open positions in a contract, and it increases or decreases based on net positioning.
If the Open Interest decreases, it means that there are more aggressive sellers than buyers. However, an increasing Open Interest indicates a surge in aggressive buyers. In LINK’s case, the large Open Interest might help the price break through the resistance.
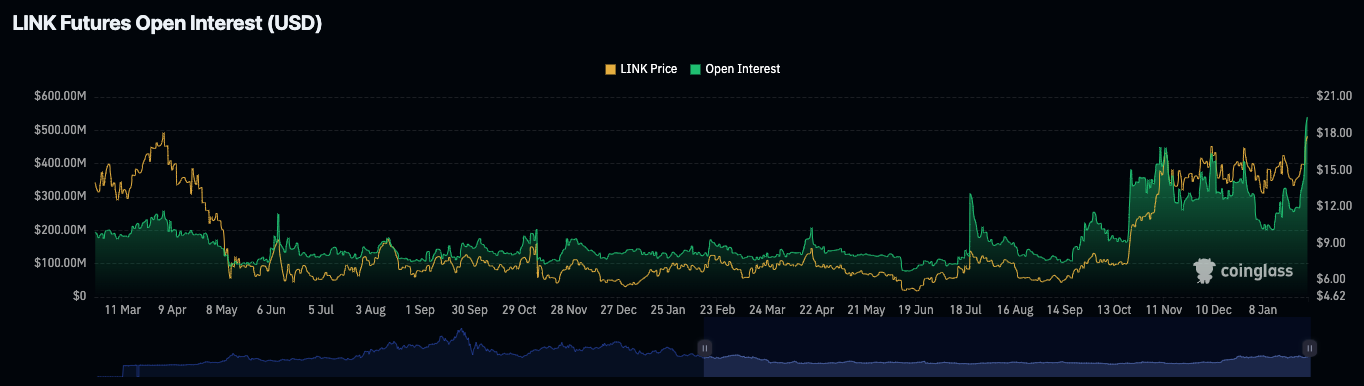
Should this be the case, LINK might jump toward $19.50, and if the momentum is very bullish, a move in the $20 direction could be validated.
Disclaimer: The information presented in this article is for informational and educational purposes only. The article does not constitute financial advice or advice of any kind. Coin Edition is not responsible for any losses incurred as a result of the utilization of content, products, or services mentioned. Readers are advised to exercise caution before taking any action related to the company.


