


 Price and Volume Surge Over the Past 24 Hours")
- Wu Blockchain revealed that LINK was the best performer in the top 15 list after recording a 24-hour gain of 18+%.
- CoinMarketCap data indicated that LINK’s price had continued to rise since Wu Blockchain’s post.
- From a technical perspective, LINK had broken above several resistance levels during the past 48 hours.
Wu Blockchain revealed in an X post today that the price of Chainlink (LINK) surged more than 18% over the past 24 hours. According to the post, this price spike was the biggest gain recorded on the top 15 list over the past 24 hours. During the same period, the trading volume for the LINK smart contract also skyrocketed to $2.3 billion.
Meanwhile, CoinMarketCap data indicated that LINK’s price had continued to rise after Wu Blockchain’s post. Subsequently, the cryptocurrency’s 24-hour gain stood at just under 26% at press time. This latest increase in price also pushed the altcoin’s weekly performance to +30.91%. As a result, the cryptocurrency was trading hands at $9.61.
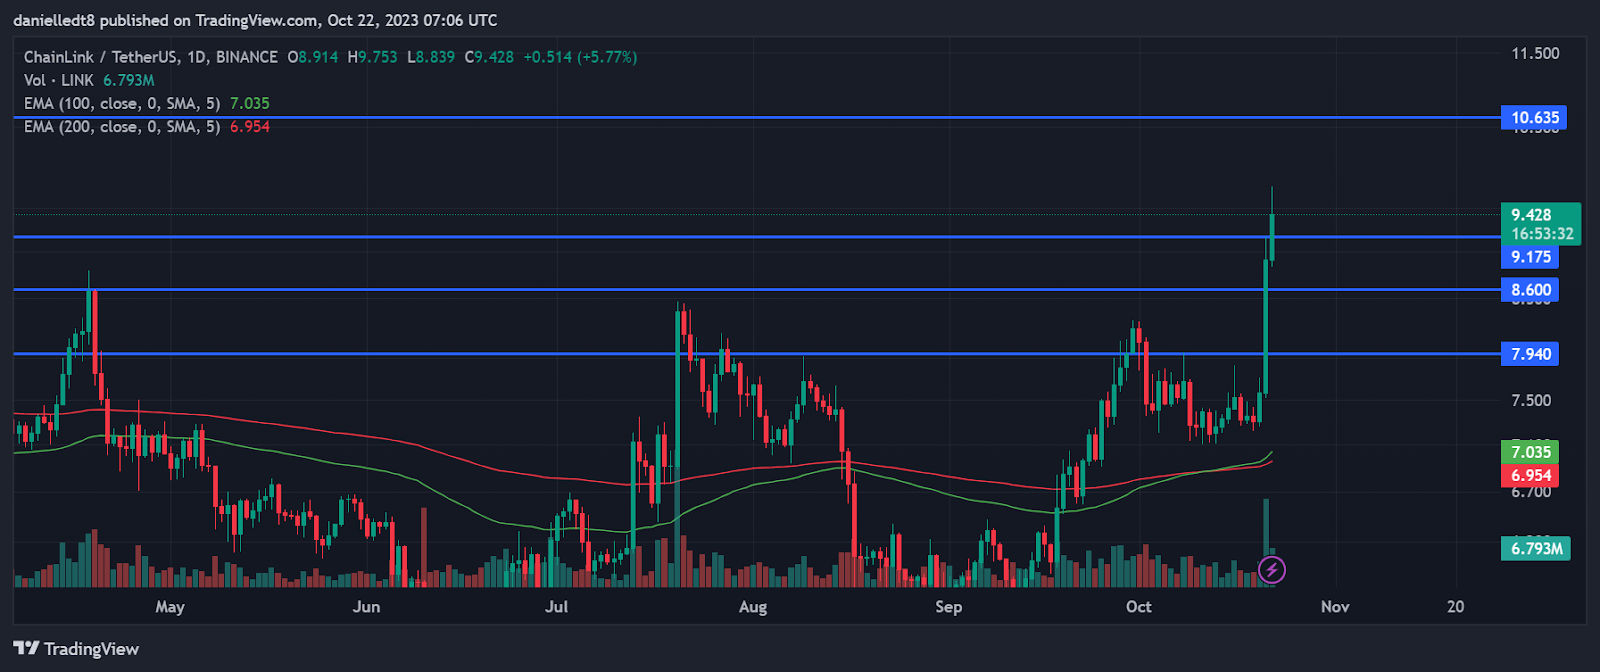
From a technical perspective, LINK had blown past several resistance levels over the past 24-48 hours. The first barrier that the altcoin breached was the resistance level at $7.940. Thereafter, LINK’s price broke above the $8.60 and $9.175 thresholds, and continued to trade above these levels at press time.
Should LINK close today’s trading session above the $9.175 mark, then it may have the foundation needed to rise to the subsequent resistance level in the coming couple of days. In this scenario, the cryptocurrency’s value could rise to as high as $10.635 in the coming week.
On the other hand, if LINK closes a daily candle below the $9.175 price point, then it may retest the $8.60 support level. Should the sell pressure persist, the altcoin’s value could call to $7.940 in the next couple of days.
Traders and investors will want to take note of the fact that a long-term bullish technical indicator was recently triggered on LINK’s daily chart. Over the past 48 hours, the 100-day EMA line crossed above the 200-day EMA line. This suggested that long-term momentum has shifted in favor of bulls and LINK’s price may continue to rise in the coming few weeks.
Disclaimer: The information presented in this article is for informational and educational purposes only. The article does not constitute financial advice or advice of any kind. Coin Edition is not responsible for any losses incurred as a result of the utilization of content, products, or services mentioned. Readers are advised to exercise caution before taking any action related to the company.


