![Aptos-[APT]-price-analysis](https://coinedition.com/wp-content/uploads/2022/10/19.-Aptos-APT-price-analysis.jpg "Could APT Bulls Seize Market and Break Current Downward Trend?")
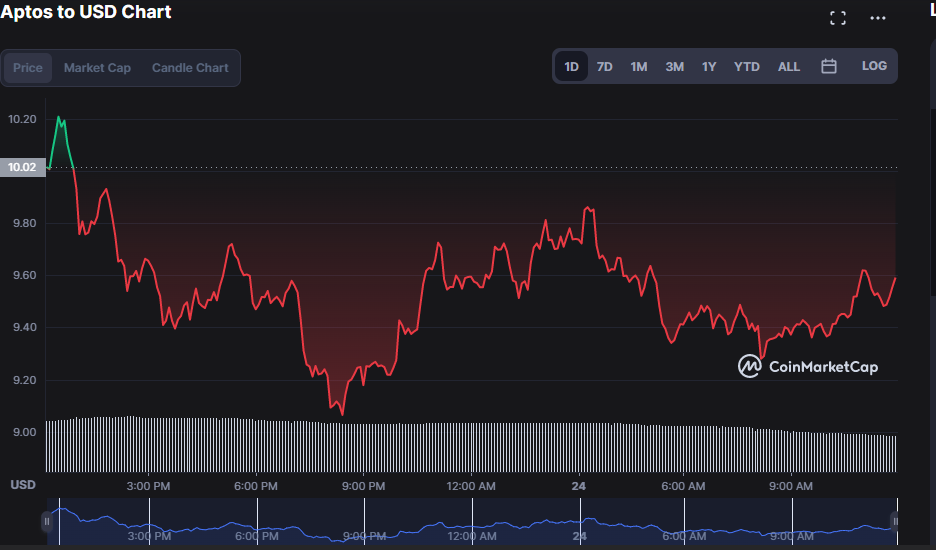
- Price of APT plunged by 1.49% to $9.61 from the previous day, giving bears dominance of the APT market.
- Prices for APT clearly reflect a bearish market.
- Technical signs indicate that the bulls’ fight to regain the market is imminent.
The price of the cryptocurrency has been declining over the past 24 hours, retracing from its most recent high of $10.21, according to Aptos (APT) pricing data. After reaching its all-time high of $10.21, APT encountered a significant resistance that caused it to fall to its current price.
APT fell by 5.33% during the slump, reaching a low of $9.54.
Market capitalization for APT is $1,240,311,710, down 5.0%, while its 24-hour trading volume is $1,127,572,323, down 30.18%.
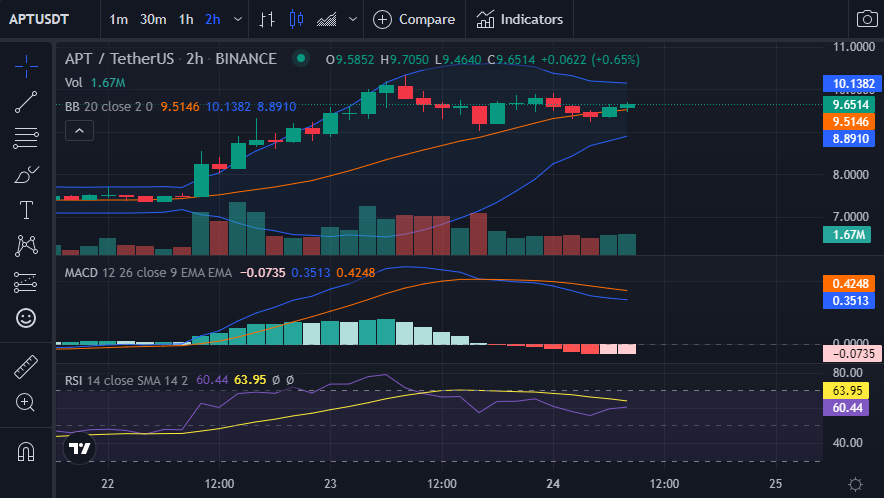
The Bollinger Bands are getting narrower, according to the 2-hour price data, with the upper band hitting at 10.1370 and the lower band touching at 8.8909. This move denotes a reduction in market volatility. The APT market indicates that the market is trending downward with a tendency to the lower band.
In addition, the blue MACD line, which has a reading of 0.3489 and is pointing south, hovers below the signal line. Additionally, the histogram is in the negative territory, with a reading of -0.0778 indicating a downward trend.
The market is neither overbought nor oversold as indicated by the Relative Strength Index (RSI) reading of 60.69, which suggests that price movement may move in any direction.
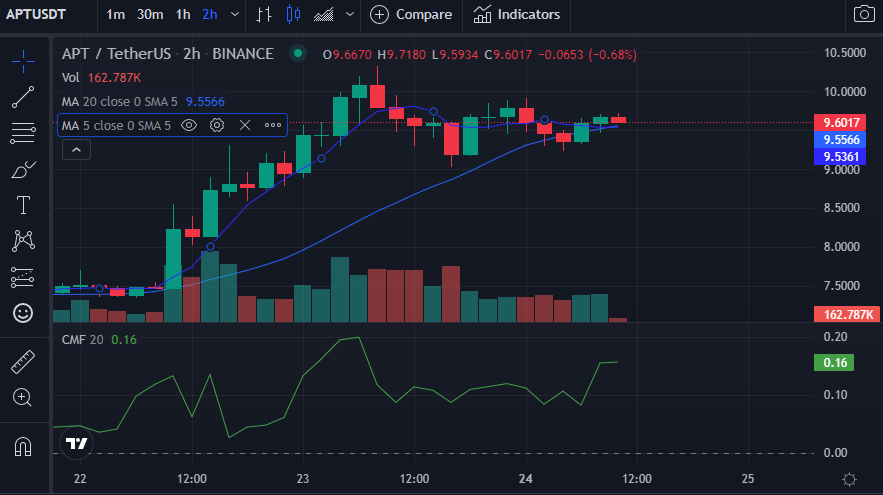
The reading for the Chaikin Money Flow (CMF) is 0.16. This indicator reflects a bullish momentum when it reads in the positive region. Thus, this price chart activity suggests that the bulls are attempting to retake the market.
Additionally, reflecting a positive momentum, the market is going above the Moving Averages. Also, the 5-day MA hits at 9.5567, which is higher than the 9.5374 touch of the 20-day MA. This action displays a bullish crossing, indicating that the current market is about to reverse its direction.
In order to defeat the bears’ supremacy and stop the negative movement, the bulls must retain the resistance level and push APT prices higher.
Disclaimer: The views and opinions, as well as all the information shared in this price analysis, are published in good faith. Readers must do their own research and due diligence. Any action taken by the reader is strictly at their own risk, Coin Edition and its affiliates will not be held liable for any direct or indirect damage or loss.
Disclaimer: The information presented in this article is for informational and educational purposes only. The article does not constitute financial advice or advice of any kind. Coin Edition is not responsible for any losses incurred as a result of the utilization of content, products, or services mentioned. Readers are advised to exercise caution before taking any action related to the company.
")


