


- The MACD and RSI on the 4-hour chart suggested SHIB’s rise to $0.000027.
- A weak directional movement could push DOGE to swing between $0.14 and $0.16.
- XRP formed a golden cross, indicating a possible rise to $0.56.
Several cryptocurrencies experienced relief in the last 24 hours despite a week full of ups and downs. Out of the many that stabilized, Shiba Inu (SHIB), Dogecoin (DOGE), and Ripple (XRP) were part.
However, it is expected that the broader market will experience a high level of volatility in the coming weeks. Will these cryptocurrencies survive the expected fluctuations? Let’s find out in this analysis.
Shiba Inu (SHIB)
At press time, SHIB was finding it difficult to rise beyond $0.000023.This was because bears had found a way to halt its earlier rising momentum. But press time data from the Relative Strength Index (RSI) showed that bulls were not having it as the buying momentum continued to increase.
If bulls take bears out of the way, the rise in momentum could key SHIB toward the $0.000027 resistance. On the other hand, an unsuccessful attempt might drive the token down to $0.000020.
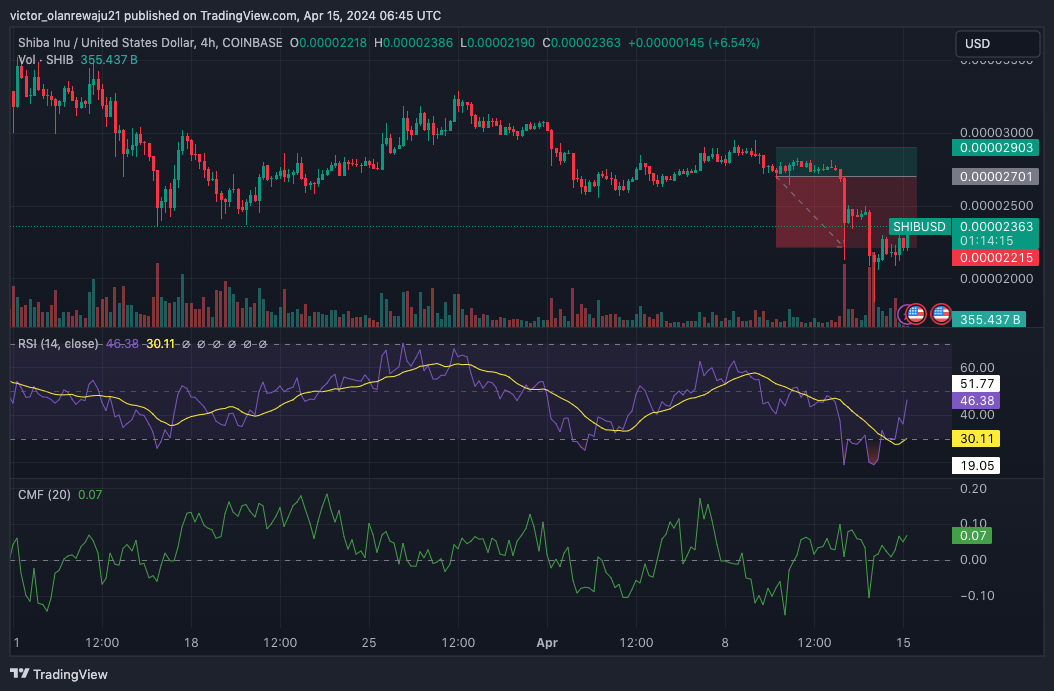
Meanwhile, the Moving Average Convergence Divergence (MACD) crossed above the zero midpoint, reinforcing the signals shown by the RSI.
Dogecoin (DOGE)
DOGE changed hands at $0.15 according to the 4-hour chart. Like SHIB, DOGE has not been able to break out after its recent downturn.
However, the coin’s structure differed from the other meme coin with indications shown by the Elder Force Index (EFI). As of this writing, the EFI has flatlined, confirming that Dogecoin’s price might evade a notable increase in the short-term
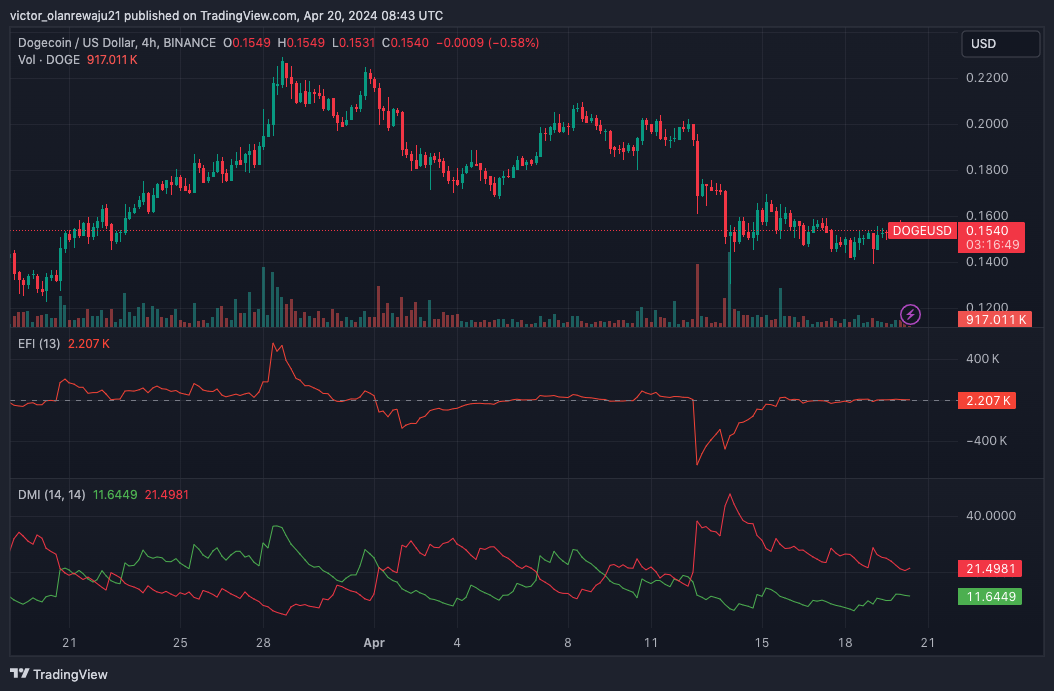
Should this be the case, the price of the cryptocurrency might swing between $0.14 and $0.16. Furthermore, the Directional Movement Index (DMI) aligned with the viewpoint as the +DMI (green) remained below the -DMI (red).
Ripple (XRP)
As of this writing, the Exponential Moving Average (EMA) on the 4-hour chart displayed a bullish bias for XRP. Previously, the 9 EMA (blue) crossed below the 20 EMA yellow). But on April 19, that position changed as the EMAs formed a golden cross.
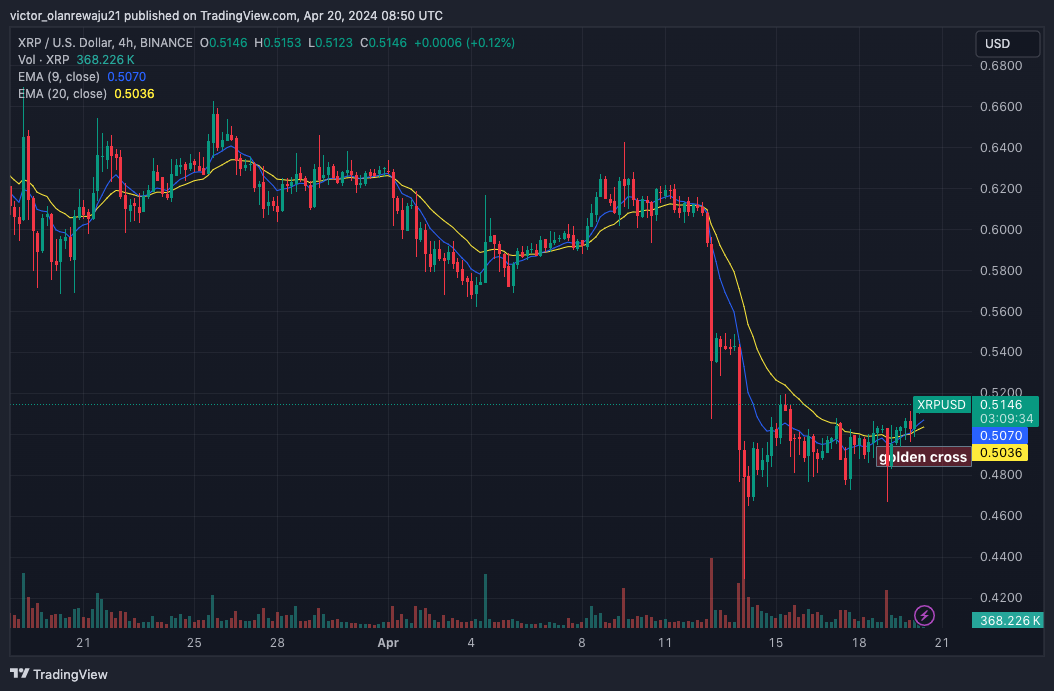
This flipping was vital to the token’s price action which was XRP rise to $0.51. Despite the trend, XRP risked a possible decline as the price was still close to both EMAs. Should the price fall below the 9 and 20 EMA, the value could drop as low as $0.46.
But a further extension could drag XRP higher, and an increase toward $0.56 could be an option within a few days.
Disclaimer: The information presented in this article is for informational and educational purposes only. The article does not constitute financial advice or advice of any kind. Coin Edition is not responsible for any losses incurred as a result of the utilization of content, products, or services mentioned. Readers are advised to exercise caution before taking any action related to the company.


