


- The global cryptocurrency market cap decreased by 1.62% over the past 24 hours.
- BTC, PEPE, and CRV all dropped below significant price points during the past day of trading.
- Meanwhile, a noteworthy bullish technical flag was on the verge of being triggered on SOL’s daily chart.
Following its positive start to the month, the cryptocurrency market saw its valuation drop 1.62% over the past 24 hours. Consequently, the market’s combined capitalization was estimated to be $1.09 trillion at press time, according to CoinMarketCap data. During this period, Bitcoin (BTC), Pepe (PEPE), Solana (SOL), and Curve DAO Token (CRV) all recorded losses.
A possible reason that the market rose at the beginning of the month was the anticipation surrounding multiple Ethereum-based exchange-traded funds (ETF) getting approved. Over the past 48 hours, VanEck’s ETH ETF application was approved, and trading for the ETF went live.
This noteworthy development may have triggered a wave of sell volume driven by the “buy the rumor and sell the news” trend that has been evident in the cryptocurrency market during this latest bear market. On the other hand, the influx of sell pressure may also just be traders engaging in profit-taking to recover some of the losses encountered during this bear market.
Bitcoin (BTC)
The market leader dropped back below a key price point over the past 24 hours. Nevertheless, BTC’s price may resume its ascent over the coming few days as the cryptocurrency continues to trade within a positive price channel.
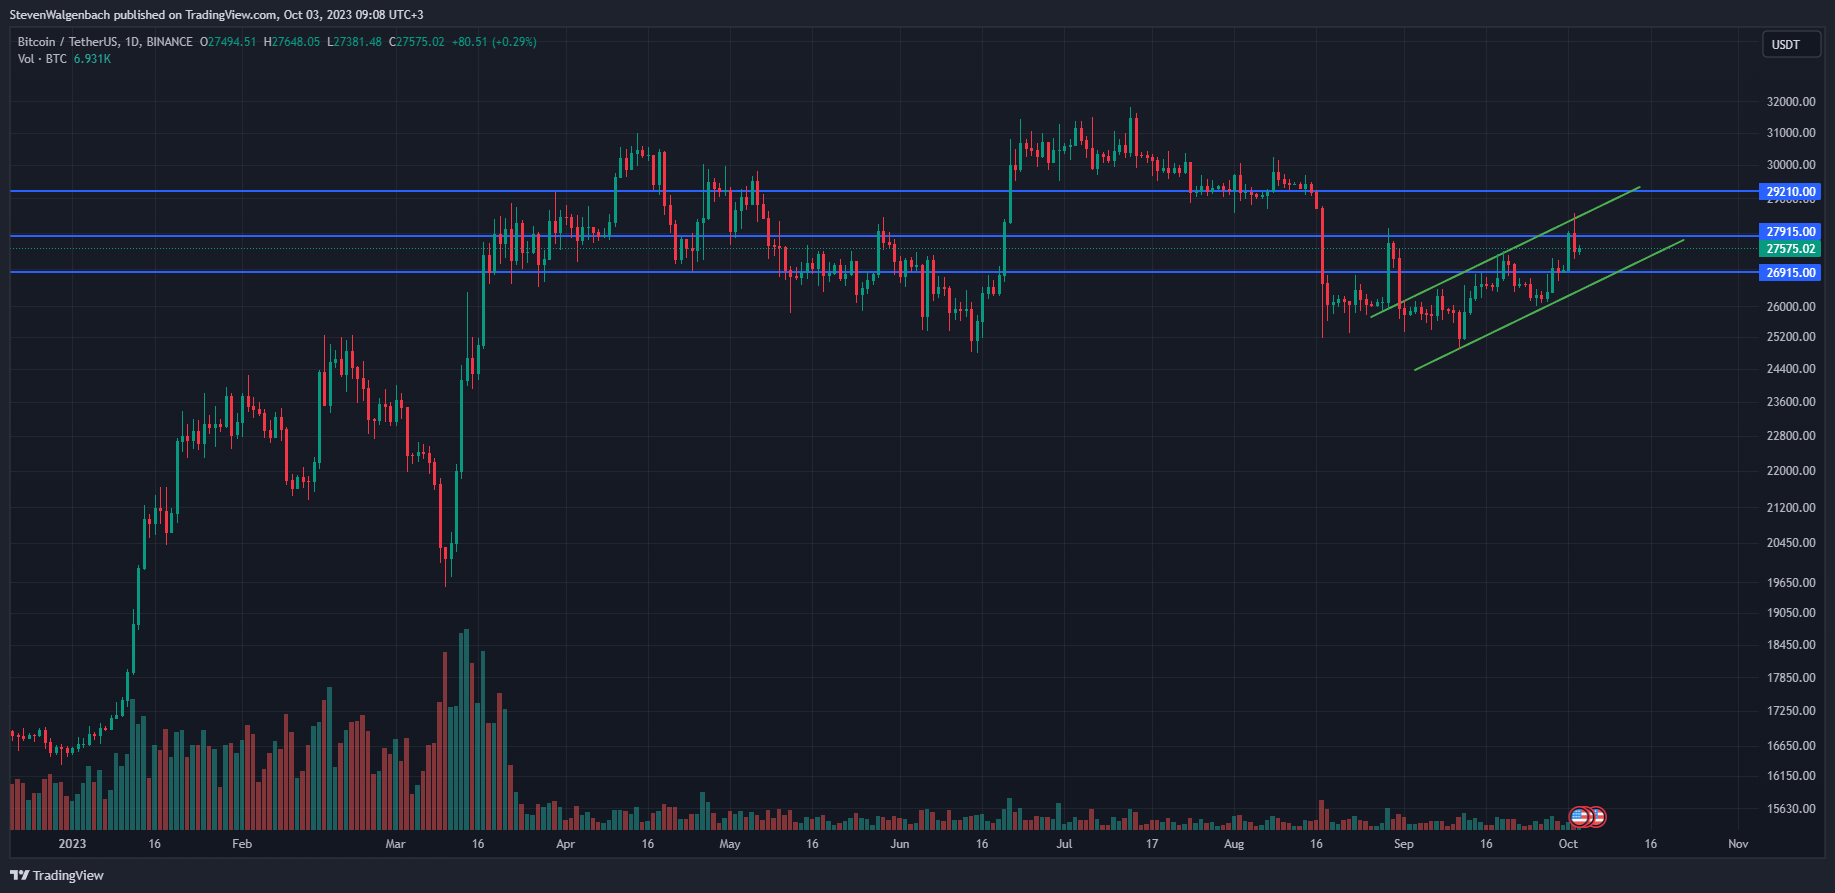
Throughout the past 24-hour cycle, BTC’s price dropped back below $27,915 and continued to trade below this mark at press time. Despite this price correction, the leading cryptocurrency was still trading within a positive price channel that had formed on its daily chart over the past 3 weeks.
Should BTC’s price break below the next support level at $26,915 within the coming few days, then it will also break out of the ascending price channel. Conversely, if the cryptocurrency is able to remain above $26,915 in the next 48 hours, then it may continue the positive trend that it had been in for the previous couple of weeks.
In this bullish scenario, BTC may reclaim the support of the $27,915 mark. Thereafter, bulls may identify a break above this price point as a positive sign, potentially leading to an increase in buy pressure. Subsequently, the cryptocurrency’s price could rise to as high as $29,210 in the following couple of days.
Pepe (PEPE)
Similar to BTC, PEPE also dropped below a significant level over the past day of trading. As a result, technical indicators seemed to be shifting in favor of sellers at press time.
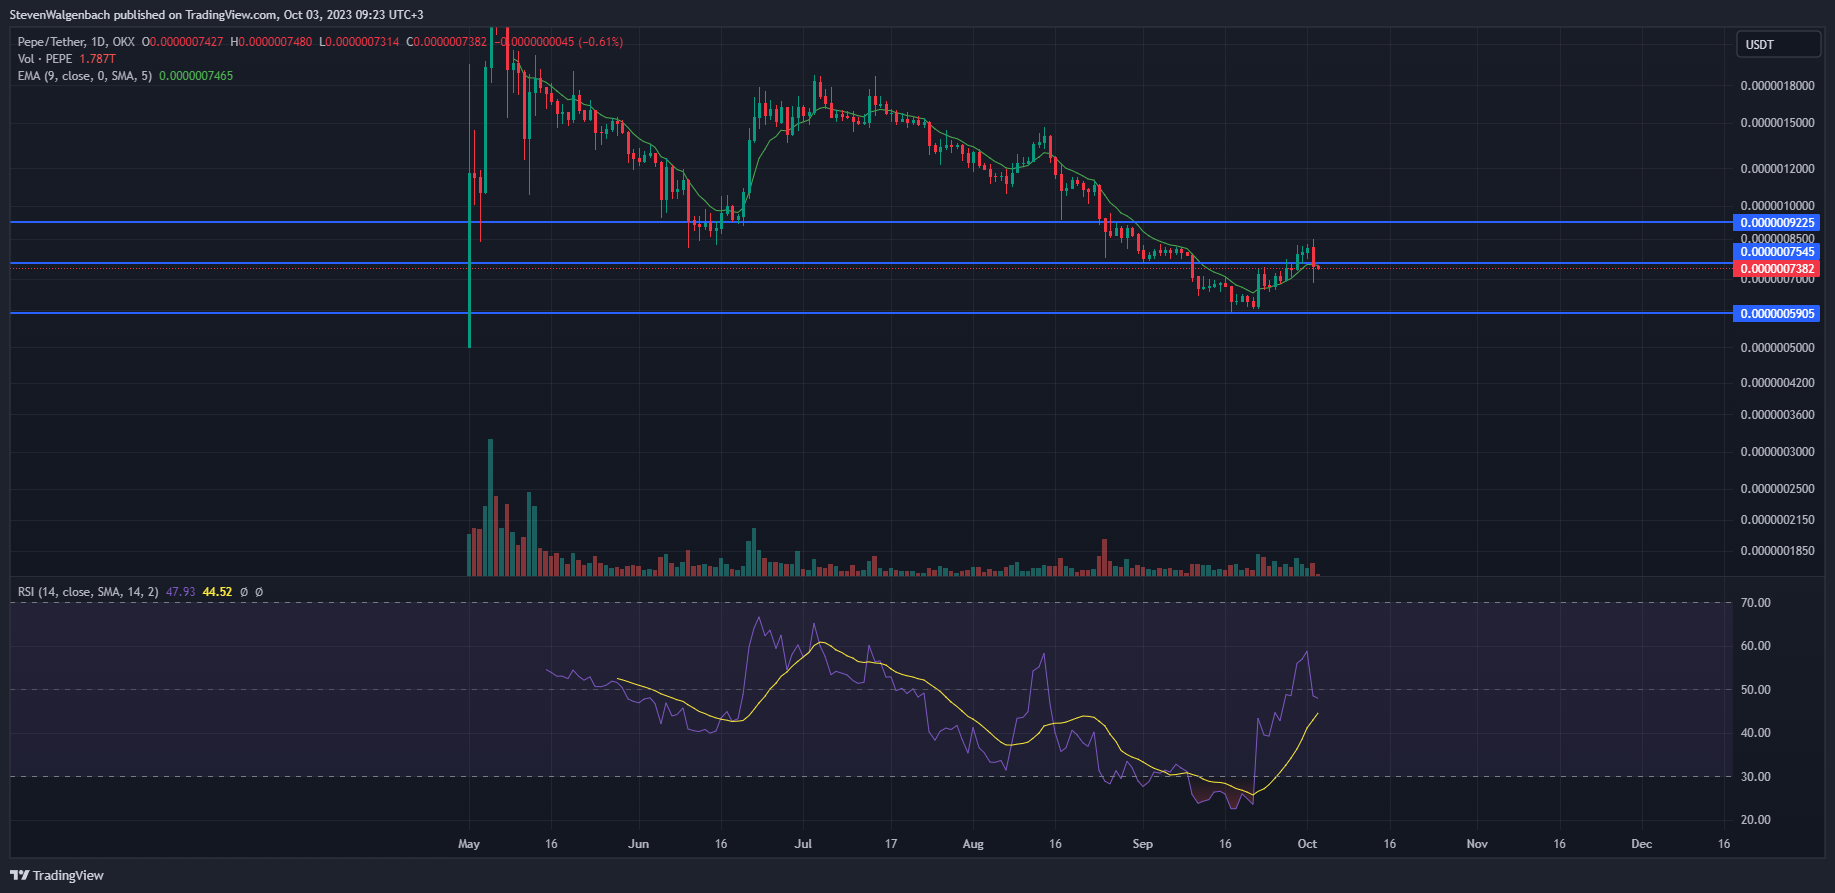
PEPE fell back below $0.0000007545 during the last 24 hours. In addition to this, the meme coin’s price also broke below the 9-day EMA line. If the altcoin closes today’s daily candle below this technical indicator, then it may be at risk of falling to the immediate support level at $0.0000005905 in the following few days.
Conversely, a daily candle close above the 9-day EMA line, which was situated at around $0.0000007466 at press time, could invalidate this bearish thesis. In this scenario, PEPE’s price may climb to as high as $0.0000009225 through the course of the following week.
Traders and investors will want to take note of the fact that a significant bearish technical flag was on the cusp of being triggered. At press time, the daily RSI line was looking to cross below the daily RSI SMA line. Should these 2 technical indicators cross in the next 24-48 hours, it may suggest that sellers have gained the upper hand on PEPE’s daily chart.
Solana (SOL)
SOL’s price has been in a consolidation phase throughout the past 3 days. This sideways trading period may soon come to an end, as a noteworthy bullish technical flag was on the verge of being triggered.
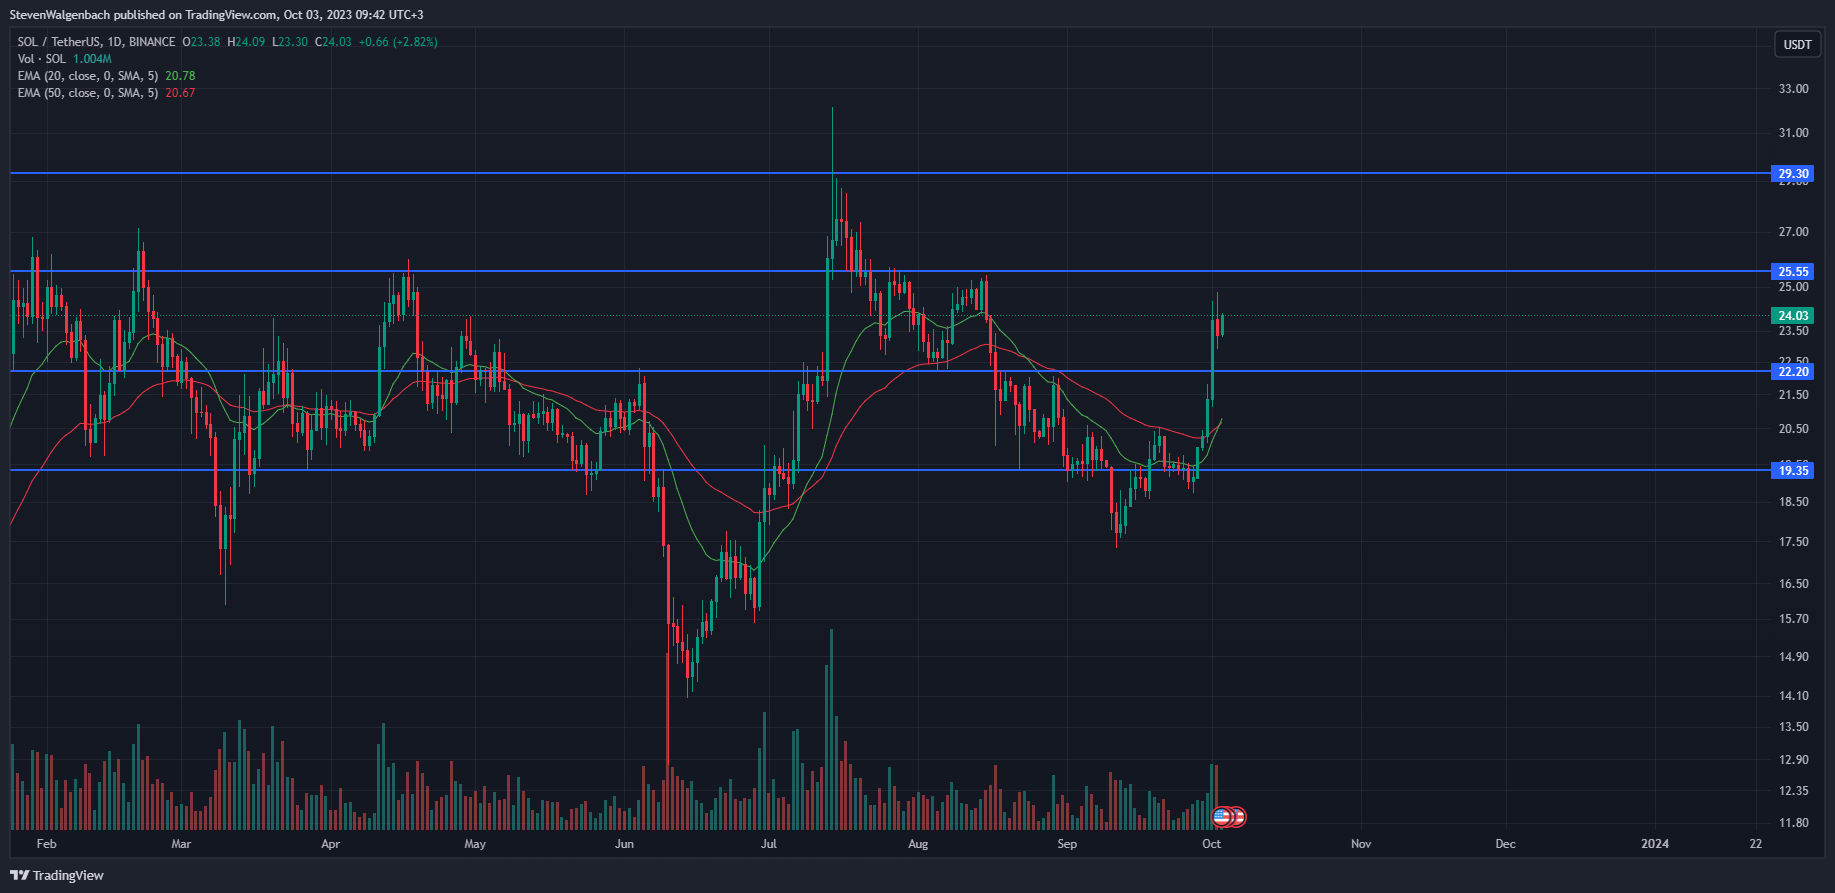
At press time, SOL was trading between $22.20 and $25.55 after the altcoin flipped the $22.20 mark into support on Sunday. Meanwhile, technical indicators suggested that SOL’s price may continue to rise in the next few days.
Most notably, the 20-day EMA line was looking to cross above the 50-day EMA line. Should these 2 EMAs cross, it will trigger a significant medium-term bullish technical flag which could lead to the cryptocurrency’s price rising in the following few days.
In this bullish scenario, SOL could attempt to overcome the $25.55 barrier. Thereafter, a daily candle close above this major price point could give SOL the foundation needed to continue rising to $29.30 within the subsequent week.
This bullish thesis will be invalidated if SOL’s price falls below $22.20 in the upcoming 48 hours. Should SOL break below this level, it will open up the risk of the altcoin continuing to drop to the next key support level at $19.35.
Curve DAO Token (CRV)
Technical indicators on CRV’s daily chart suggest that sellers have gained an upper hand against bulls. This was after the cryptocurrency plummeted below a significant price point over the past 24 hours.
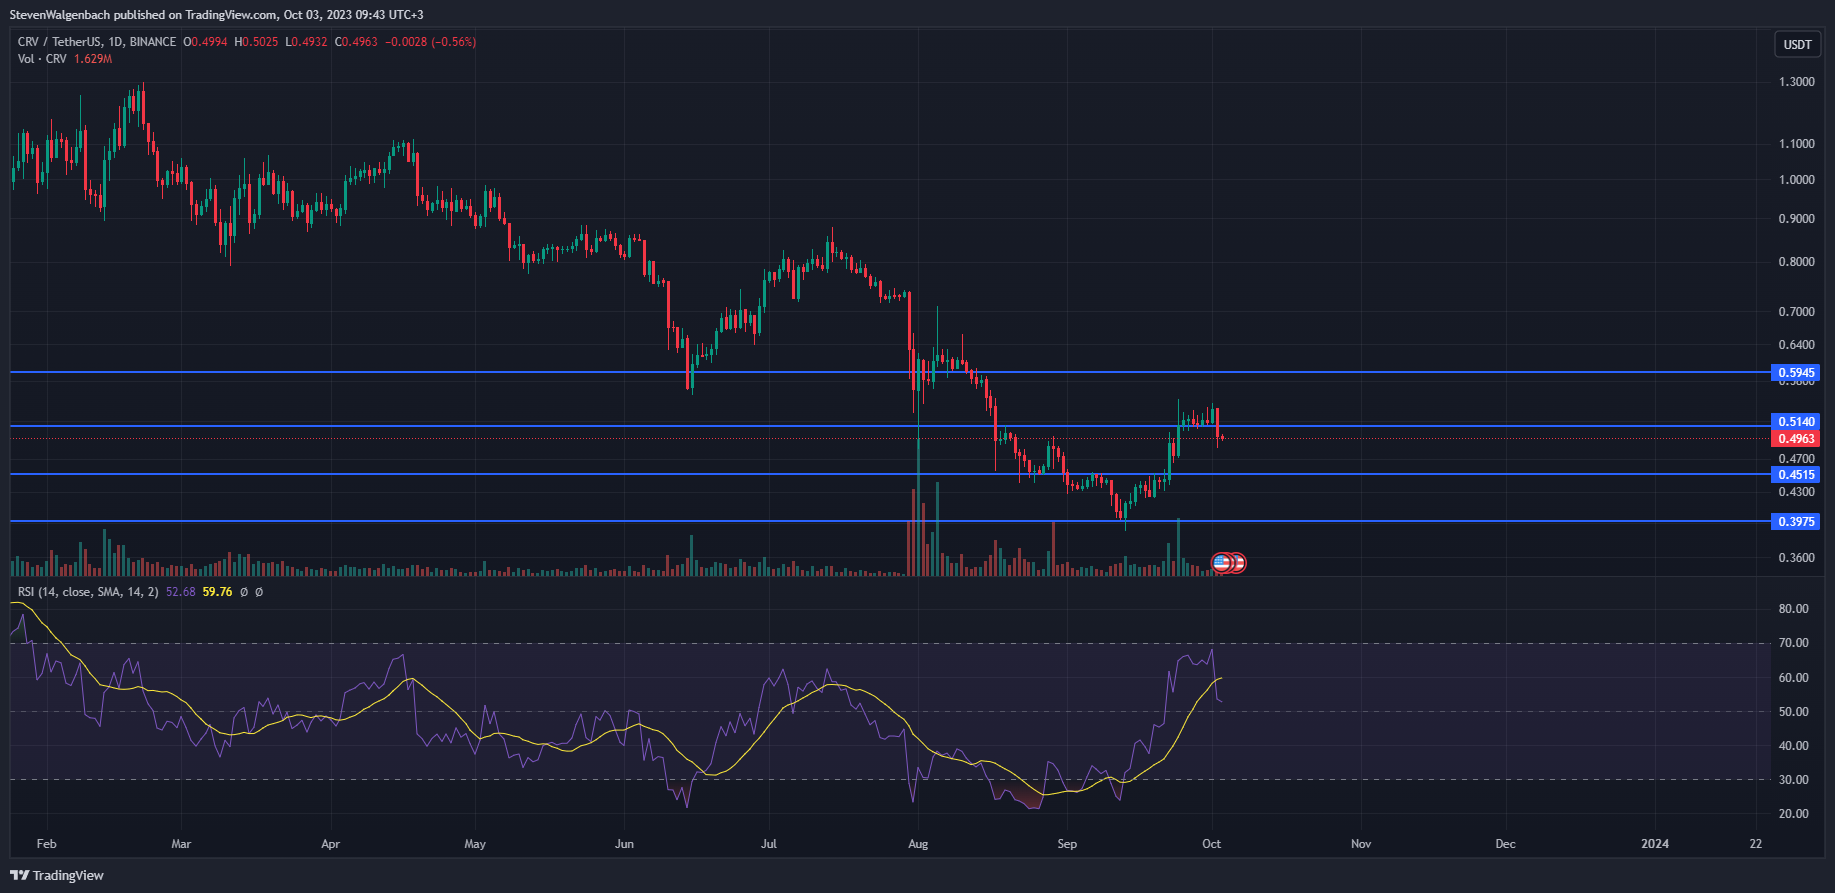
During the previous 24 hours, CRV’s price fell below the $0.5140 mark and continued to trade below this level at press time. Consequently, the altcoin’s price could be at risk of falling to the next support level of $0.4515.
Furthermore, the RSI line crossed below the RSI SMA line on CRV’s daily chart throughout the past 24-hour cycle. This suggests that sellers’ strength has increased – granting sellers a slight advantage over buyers. As a result, traders may continue to exert sell pressure on CRV’s price, which may lead to it breaking below $0.4515 to potentially fall to $0.3975 in the short term.
This bearish thesis may be invalidated if the altcoin’s price is able to close a daily candle above $0.5140 in the coming 48 hours. In this scenario, CRV may have the support needed to rise to the next threshold at $0.5945 in the following week.
Disclaimer: The views and opinions, as well as all the information shared in this price analysis, are published in good faith. Readers must do their own research and due diligence. Any action taken by the reader is strictly at their own risk. Coin Edition and its affiliates will not be held liable for any direct or indirect damage or loss.
Disclaimer: The information presented in this article is for informational and educational purposes only. The article does not constitute financial advice or advice of any kind. Coin Edition is not responsible for any losses incurred as a result of the utilization of content, products, or services mentioned. Readers are advised to exercise caution before taking any action related to the company.


