


 Price Prediction 2024-2030: Will DASH reach $100 Soon?")
- 2024 DASH is expected to range between $14.95 and $61.95, reflecting market volatility.
- Due to post-BTC halving excitement, Dash could surge to $280.85 by 2028, with a potential dip to $154.14.
- DASH might surpass its all-time high of $1,625 by 2040, reaching $2,000 by 2040.
Dash, an open-source cryptocurrency forked from Bitcoin, was crafted to solve many issues plaguing its predecessor. Known for its rapid governance and ability to support low-cost, instant transactions, Dash has carved out its own space in the crypto world.
Though its peak popularity in 2018 and 2019 has waned, Dash remains a formidable player, thanks to its robust technology and practical uses. With every passing year, Dash inches closer to its ambition of becoming the go-to payment solution.
While Dash hasn’t been the subject of much recent attention, it did experience a surge in early 2021, riding the wave of a bullish crypto market. However, it fell short of reaching its previous all-time high.
The current outlook for Dash might seem cautious, with the market sentiment leaning bearish and the Fear & Greed Index sitting at 27. But don’t let this fool you—Dash has seen over half its recent days in the green.
Could it be poised to shatter its previous records? The possibilities are intriguing. To explore more, read this in-depth forecast article on Coin Edition.
Table of contents
- Dash (DASH) Real-Time Market Overview
- What is Dash (DASH)?
- Dash (DASH) Current Market Status
- Dash (DASH) Price Analysis 2024
- Dash (DASH) Price Prediction 2024
- Dash (DASH) Price Prediction 2025
- Dash (DASH) Price Prediction 2026
- Dash (DASH) Price Prediction 2027
- Dash (DASH) Price Prediction 2028
- Dash (DASH) Price Prediction 2029
- Dash (DASH) Price Prediction 2030
- Dash (DASH) Price Prediction 2040
- FAQs
Dash (DASH) Real-Time Market Overview
HTTP Request Failed... Error: file_get_contents(https://pro-api.coinmarketcap.com/v2/cryptocurrency/quotes/latest?slug=dash): Failed to open stream: HTTP request failed! HTTP/1.1 429 Too Many Requests
What is Dash (DASH)?
Dash (DASH) is a digital currency designed to deliver swift, cost-effective payments with a strong emphasis on ease of use and privacy. Introduced by software developer Evan Duffield on January 18, 2014, Dash first appeared as XCoin. It later became Darkcoin and was finally rebranded in March 2015 to reflect its goal of being the go-to “digital cash.”
What truly makes Dash stand out is its cutting-edge master node system. This feature allows transactions to be completed in seconds through InstantSend, while CoinJoin ensures enhanced privacy by making transactions more challenging to trace.
Those who own at least 1,000 Dash can run master nodes, earning rewards and contributing to the network’s reliability. However, Dash isn’t just another cryptocurrency; it’s a practical tool for everyday transactions. Its DashDirect app, launched in 2021, has enabled users to shop at more than 155,000 stores and 125 websites, often with added discounts.
This real-world application sets Dash apart from the many digital currencies that are still struggling for practical use. With a unique two-tier network structure combining proof-of-work mining and the power of master nodes, Dash offers a compelling option for those seeking an efficient and private digital currency.
Dash (DASH) Current Market Status
DASH has shown modest gains over the past 24 hours, with its price rising by 0.52% to $24.37. This slight increase pushed its market capitalization to approximately $291.03 million, representing a 0.53% uptick and securing its position as the 150th most prominent crypto by market cap.
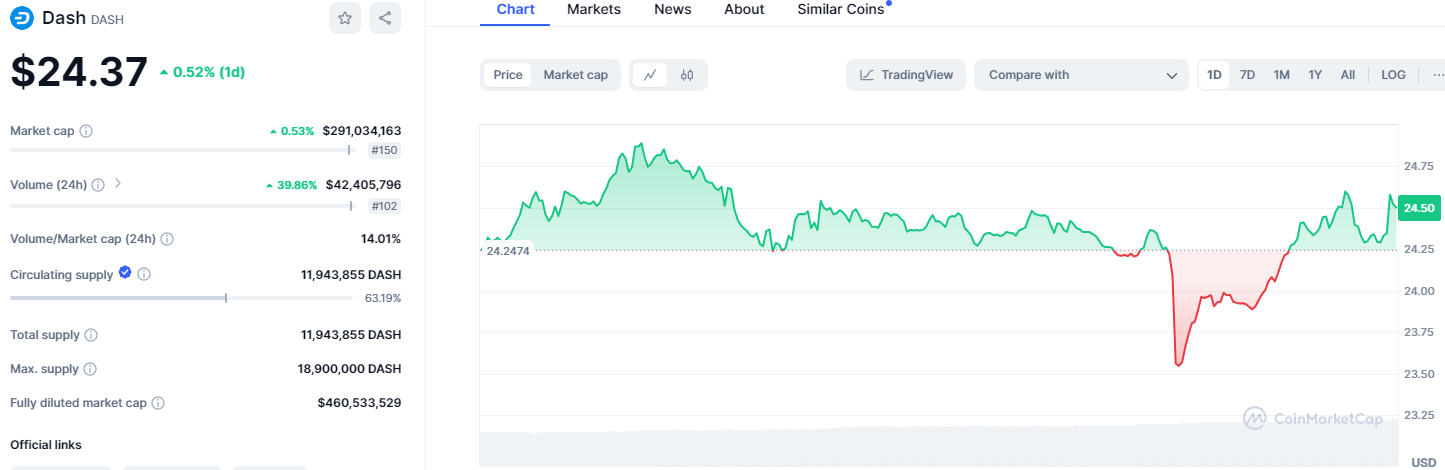
Trading activity has been notably robust, with a 39.86% increase in 24-hour volume, reaching $42.40 million, which accounts for 14.01% of the market cap. Throughout the day, Dash’s price exhibited significant volatility. After an initial climb that peaked near $24.75, the price experienced a sharp drop, dipping below $24.00.
However, the cryptocurrency demonstrated resilience, recovering to stabilize around $24.50. This pattern reflects the ongoing interest and active trading in Dash as investors respond to the dynamic market conditions.
Dash (DASH) Price Analysis 2024
With a circulating supply of 11,943,873 DASH, representing 63.19% of its maximum supply of 18.9 million, Dash continues to attract attention, particularly for those closely monitoring its short-term movements for trading opportunities. In this section, Coin Edition provides a detailed analysis of DASH’s price performance 2024, offering insights into potential trends and factors influencing its value.
Dash (DASH) Price Analysis – Bollinger Bands
The Bollinger Bands indicate that Dash is currently experiencing low volatility, with the price hovering from the lower band. This setup often suggests that the market is either at a potential turning point or preparing for a new trend.
As DASH moves toward the middle Bollinger Band, it could suggest the beginning of a recovery, potentially pushing the price toward the upper band at $31.55. Conversely, if Dash breaks below the lower band, it might signal further downside, with the price possibly dropping to a low of around $18.50.
Dash (DASH) Price Analysis – Relative Strength Index
The RSI for Dash is currently in the neutral zone at 44.82, indicating that the market is relatively balanced with no strong momentum in either direction. This suggests that traders might be cautious, waiting for more precise signals before making significant moves.
However, if the RSI continues to trend upwards and surpasses the 50 mark, originating from its previous oversold conditions, this could signal the onset of a bullish trend. Such a move might push Dash’s price to test its resistance around $44.21 before the market approaches overbought conditions.
Conversely, if the RSI fails to break through the 50 level, it could reverse and drop, seeking support near the $19.06 low, potentially leading to oversold conditions. This scenario likely signals continued downward pressure, making these levels crucial for traders to monitor.
Dash (DASH) Price Analysis – Moving Average Convergence Divergence
The MACD indicator for Dash suggests that the market is still under bearish pressure, with the MACD line below the signal line and a negative histogram. However, the decreasing size of the histogram bars hints at a possible weakening of this bearish momentum.
Traders should monitor the MACD line for any potential crossover above the signal line, indicating a shift toward bullish momentum and a possible trend reversal.
Dash (DASH) Price Prediction 2024
According to the DMI indicator, the higher -DI (26.3878) than the +DI (14.6412) indicates that sellers are currently in control, and the market is more likely to experience downward movement. However, the ADX being close to 20 suggests that this bearish trend isn’t firm either, and the market might be oscillating within a range rather than trending sharply in one direction.
Given these sentiments, the DASH token is anticipated to surpass this year’s high at the $44.21 mark and peak around the 38.2 Fibonacci level at the $61.95 threshold. Nevertheless, a shift in momentum could pull the token’s value to more profound levels by the end of the year. Such an event could position DASH’s price at a low of $14.95, last seen on January 23, 2017.
Dash (DASH) Price Prediction 2025
Per Coin Edition’s projections, Dash could hit a peak of $115.50 in 2025, driven by the post-BTC halving momentum. On the downside, market corrections could see it dip to $44.21, reflecting reduced investor enthusiasm.
Dash (DASH) Price Prediction 2026
According to our forecast, Dash’s price could drop to $28.56 without significant market catalysts due to waning interest in the broader crypto market. However, amid stabilization after last year’s hype, it might reach $77.60.
Dash (DASH) Price Prediction 2027
Coin Edition predicts a rebound in 2027, with Dash potentially peaking at $138.73 as anticipation for the 2028 BTC halving builds. Nevertheless, it could fall to $61.97 due to pre-halving uncertainties and cautious investor sentiment.
Dash (DASH) Price Prediction 2028
According to Coin Edition, Dash could surge to $280.85 in 2028, propelled by post-BTC halving excitement. Yet, if the broader market faces correction after the initial hype subsides, it may experience a pullback to $154.14.
Dash (DASH) Price Prediction 2029
Coin Edition forecasts Dash to reach $370.70 in 2029, supported by strong community backing and potential technological advancements. However, as market dynamics shift, a lack of sustained momentum might lead to a dip to $215.44.
Dash (DASH) Price Prediction 2030
By 2030, Dash could peak at $523.91, reflecting its continued adoption and use in real-world applications, as predicted by Coin Edition. Conversely, it might decline to $329.16 due to market corrections or competitive pressures within the crypto space.
Dash (DASH) Price Prediction 2040
In 2040, Coin Edition envisions Dash reaching an all-time high of $2,000.00 as it solidifies its role in the digital payment ecosystem. On the other hand, it could fall to $1,150.22 if technological challenges or market disruptions arise.
FAQs
Dash is a digital currency focused on fast, low-cost transactions and privacy. It was launched in 2014 by Evan Duffield and originally known as XCoin, later rebranded as Dash to signify “digital cash.”
You can buy Dash on major cryptocurrency exchanges like Binance, Coinbase, and Kraken. You’ll need to create an account, deposit funds, and then purchase Dash using the available trading pairs like DASH/USD or DASH/BTC.
Dash can be a good investment for privacy-focused and quick transaction cryptocurrencies. However, like all cryptocurrencies, it carries significant risks, and its value can be highly volatile.
Dash’s all-time high was $1,642.22, reached on December 20, 2017, during the peak of the crypto market bull run.
DASH token will reach the $500 mark by the end of 2030, where it will reach a high of $523.91.
Dash’s circulating supply is approximately 11,943,873 DASH, which is about 63.19% of its maximum supply of 18.9 million DASH.
According to our price prediction, DASH will surpass its all-time high of $1,642 in 2040, peaking at $2,000.
The lowest price Dash ever reached was $0.2139 on February 14, 2014, shortly after its launch.
Dash was founded by Evan Duffield, a software developer who launched the cryptocurrency on January 18, 2014.
Dash was launched on January 18, 2014, originally named XCoin.
Dash can be stored in various wallets, including hardware wallets like Ledger and Trezor, mobile wallets like Dash Wallet, or desktop wallets like Exodus.
Dash could range between $14.95 and $61.95 in 2024, depending on market conditions and adoption.
Dash’s price could peak at $115.50 in 2025, driven by post-BTC halving effects, and potentially low at $44.21 due to market corrections.
The 2026 Dash might reach a high of $77.60 amid market stabilization, but it could drop to $28.56 due to reduced market interest.
As forecasted by Coin Edition, Dash could reach $138.73 in 2027 due to anticipation of a pre-BTC halving but might fall to $61.97 due to cautious investor sentiment.
Dash could surge to $280.85 in 2028, fueled by post-BTC halving excitement, though it might retract to $154.14 after the initial hype.
Dash might peak at $370.70 in 2029, driven by community support and technological advancements, but it could dip to $215.44 as market dynamics shift.
With ongoing adoption, Dash could climb to $523.91 by 2030 but decrease to $329.16 due to market corrections or competitive pressures.
2040 Dash might hit an all-time high of $2,000.00 as it solidifies its role in digital payments, but it could fall to $1,150.22 if faced with technological challenges or market disruptions.
Disclaimer: The information presented in this article is for informational and educational purposes only. The article does not constitute financial advice or advice of any kind. Coin Edition is not responsible for any losses incurred as a result of the utilization of content, products, or services mentioned. Readers are advised to exercise caution before taking any action related to the company.


