


- Indicators suggest that the AVAX price drop might be modest.
- Bullish dominance in the AVAX market comes to an end after hitting resistance at 21.18.
- Recent reports indicate that the AVAX market is pessimistic.
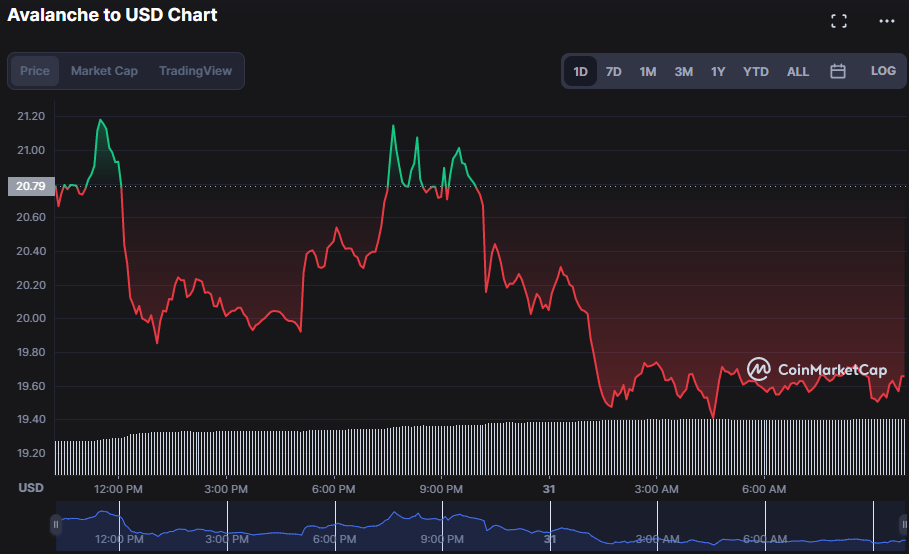
Following resistance at the intraday high of $21.18, bulls in the Avalanche (AVAX) surrender, and bears retake control of the market. AVAX’s price fell 5.88% to $19.57 as a consequence of this bear capture. The bullish hand was visible on the 24-hour chart with spikes of upswings, but due to increased bear power, bullish efforts were ruled void.
Market capitalization dropped by 5.70% to $6,164,009,051 as investors pulled out due to the bear grip and the concern of an additional price collapse. A 65.66% increase in 24-hour trading volume, to $665,980,972, demonstrates that investors remain cautiously optimistic about the market and the possibility of a price recovery.
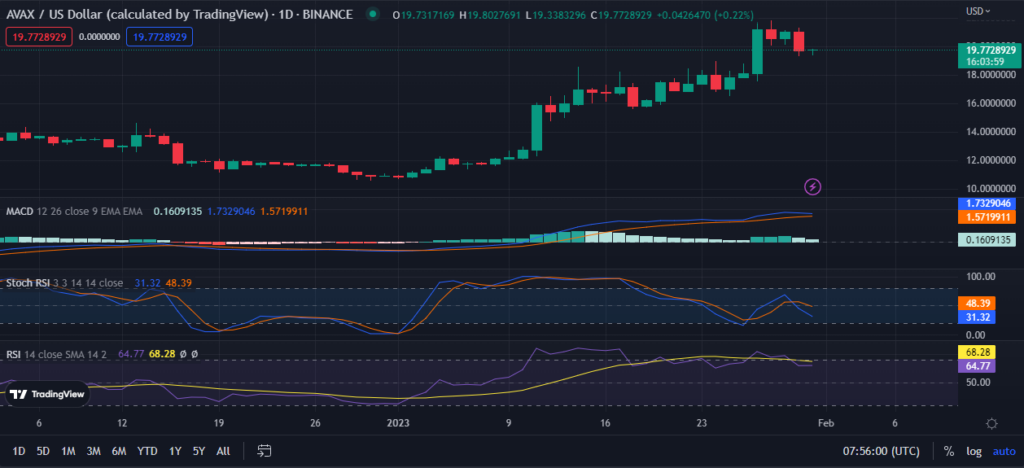
Based on the current price of AVAX and the stochastic RSI’s position below its signal line, it seems likely that the negative trend in the market will continue for the time being. Until the market shows indications of recovery, investors should be cautious about making new investments or adding to current ones.
The Relative Strength Index (RSI) is now at 64.54, trending below its signal line, adding to the gloomy picture. This development lends credence to the bleak short-term forecast and confirms the ongoing trend of AVAX market deterioration.
In spite of this, the MACD reading (1.7286104) is above the signal line, which suggests that negative momentum is fading and the market may soon start a corrective phase. This means that investors need to exercise caution before jumping into the AVAX market. The fact that the histogram is in the positive zone is supporting evidence that the price of AVAX is on the ascent.
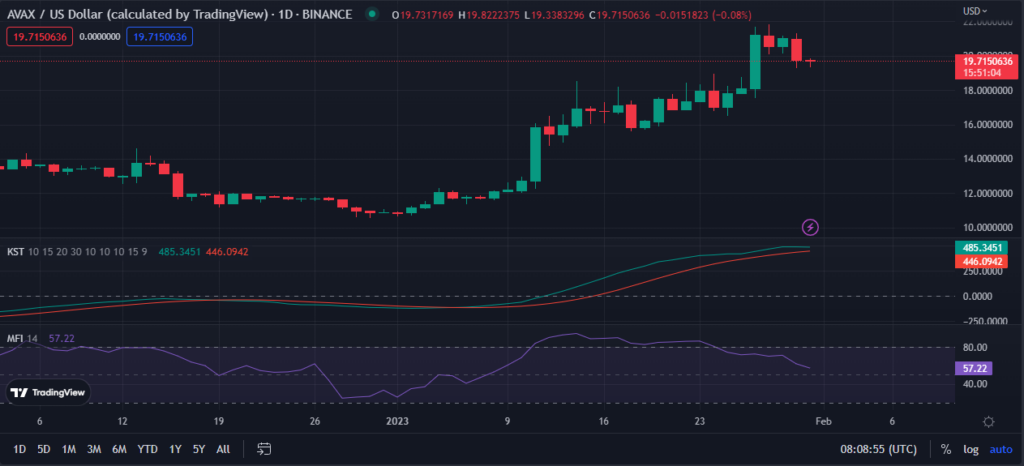
On the 1-day price chart for AVAX, the Know Sure Thing (KST) indicator reading (485.9886) is above its signal line, indicating that negative sentiment is receding as buyers are buying up shares, sending the KST indicator higher. Traders’ expectations for a turnaround in the market’s present pessimistic attitude have been raised as a result of this development.
While investors may be buying up shares, the Money Flow Index (MFI) reading of 57.22 heading south indicates that investors’ attitudes are still unsettled, and there is a potential that the bearish sentiment might continue. But the KST indicator’s general uptrend shows the bear market might not persist for long and a bull run might be on the horizon.
In order to counteract the market’s unfavorable signs, AVAX bulls must push prices higher and defend the level of resistance now in place.
Disclaimer: The views and opinions, as well as all the information shared in this price analysis, are published in good faith. Readers must do their own research and due diligence. Any action taken by the reader is strictly at their own risk. Coin Edition and its affiliates will not be held liable for any direct or indirect damage or loss.
Disclaimer: The information presented in this article is for informational and educational purposes only. The article does not constitute financial advice or advice of any kind. Coin Edition is not responsible for any losses incurred as a result of the utilization of content, products, or services mentioned. Readers are advised to exercise caution before taking any action related to the company.


