


- DOGE and SHIB’s price losses over the past 24 hours suggest that investors are getting rid of their holdings.
- DOGE’s price fell by 2.80% in the past 24 hours, causing it to break below an ascending triangle on its chart.
- SHIB’s price decreased by more than 3%, and as a result, escaped a positive price channel that had formed on its daily chart.
Both Dogecoin (DOGE) and Shiba Inu (SHIB) saw their prices slip over the past 24 hours, which suggests that meme coin investors are cashing in their holdings. Additionally, DOGE and SHIB broke out of bullish chart patterns over the past 24 hours of trading.
Dogecoin (DOGE)
CoinMarketCap indicated that DOGE saw its price drop by 2.80% over the past day, which left the meme coin trading hands at $0.06199. The intraday volume for DOGE did, however, increase by about 5.96%. As a result, the altcoin’s 24-hour trading volume settled at $238,007,814.
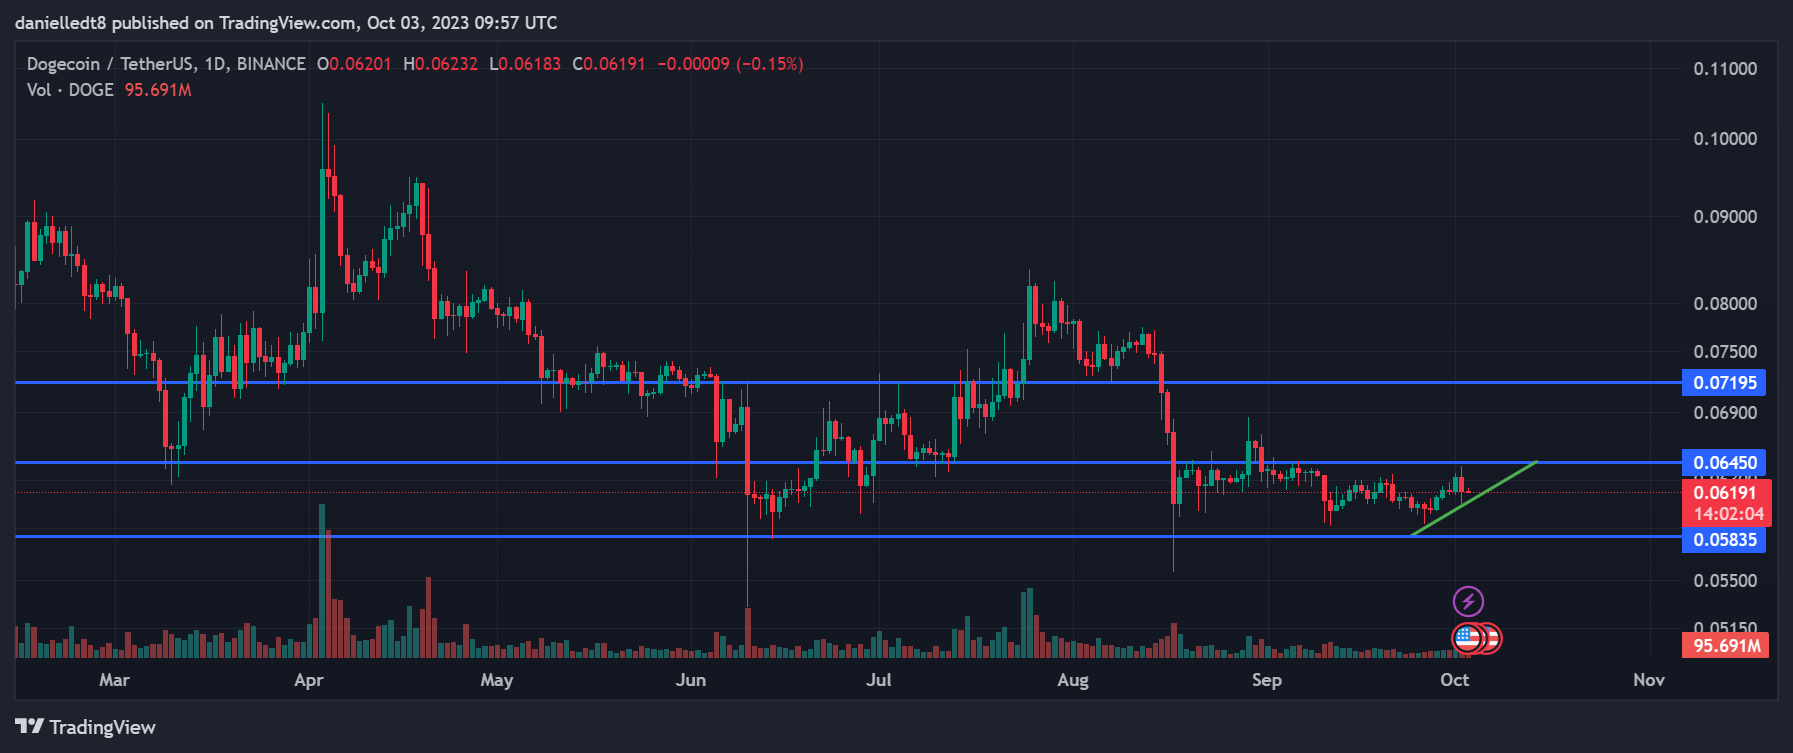
A bullish ascending triangle had formed on DOGE’s daily chart throughout the past 2 weeks. This pattern suggested that the cryptocurrency may attempt to break above $0.06450 (the base of the pattern) in the next few days. However, over the past 24 hours, DOGE’s price had broken out below this triangle pattern, suggesting that the forecasted bullish move may not take place.
As a result, the meme coin is currently exposed to the risk of correcting down to the next support level at $0.05835 through the course of the next week. This risk could be mitigated if DOGE is able to break above the aforementioned $0.06450 mark in the next few days. This may then lead to the altcoin rising to as high as $0.07195.
Shiba Inu (SHIB)
The past 24 hours were even rougher for SHIB as its price ended up decreasing by over 3%. This left the meme coin trading at $0.000007307, which was just above its daily low price of $0.000007258. On the bright side, SHIB’s price was still up by 0.46% in its weekly time frame.
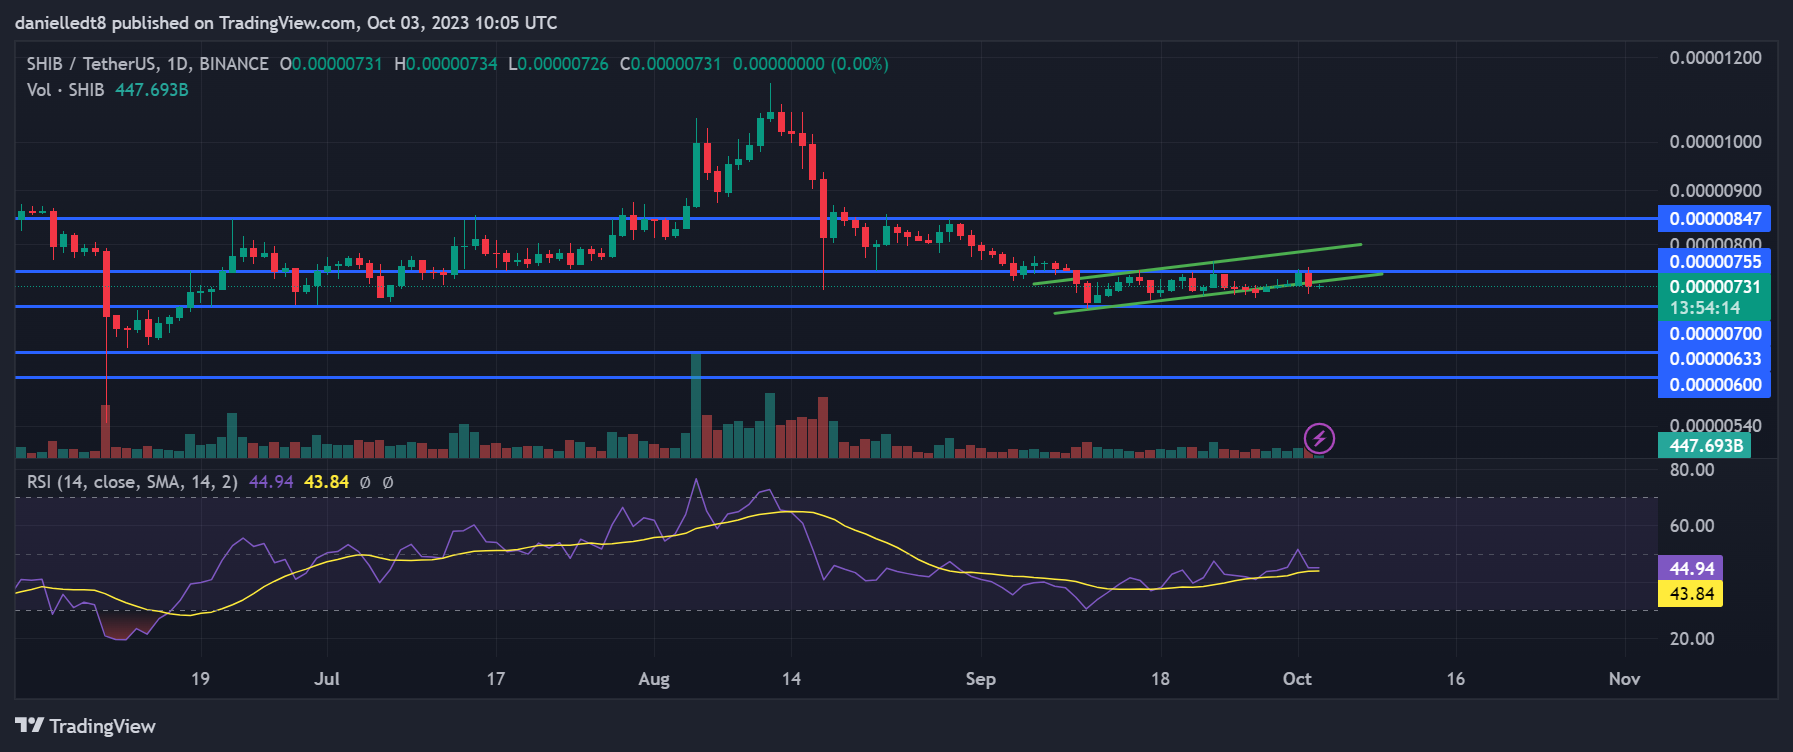
The price of SHIB escaped a positive price channel that had formed on its daily chart over the past 3 weeks. At press time, the meme coin was trading below this ascending channel, which suggested that the altcoin may be at risk of dropping to the immediate support level at $0.00000700 in the upcoming week.
Furthermore, a significant bearish technical flag was on the verge of being triggered on SHIB’s daily chart. At press time, the daily RSI line was attempting to cross below the daily RSI SMA line. Should these 2 lines cross, it may suggest that sellers have gained the upper hand. Consequently, the cryptocurrency’s price could drop to as low as $0.00000633 in the short term.
This bearish thesis may be invalidated if SHIB is able to close a daily candle above $0.00000755 in the next 3 days. In this scenario, the meme coin’s price may have the foundation needed to rise to the subsequent resistance level at $0.00000847 within the following fortnight.
Disclaimer: The views and opinions, as well as all the information shared in this price analysis, are published in good faith. Readers must do their own research and due diligence. Any action taken by the reader is strictly at their own risk. Coin Edition and its affiliates will not be held liable for any direct or indirect damage or loss.
Disclaimer: The information presented in this article is for informational and educational purposes only. The article does not constitute financial advice or advice of any kind. Coin Edition is not responsible for any losses incurred as a result of the utilization of content, products, or services mentioned. Readers are advised to exercise caution before taking any action related to the company.

 Price Prediction 2026, 2027, 2028, 2029, 2030-2050")


