


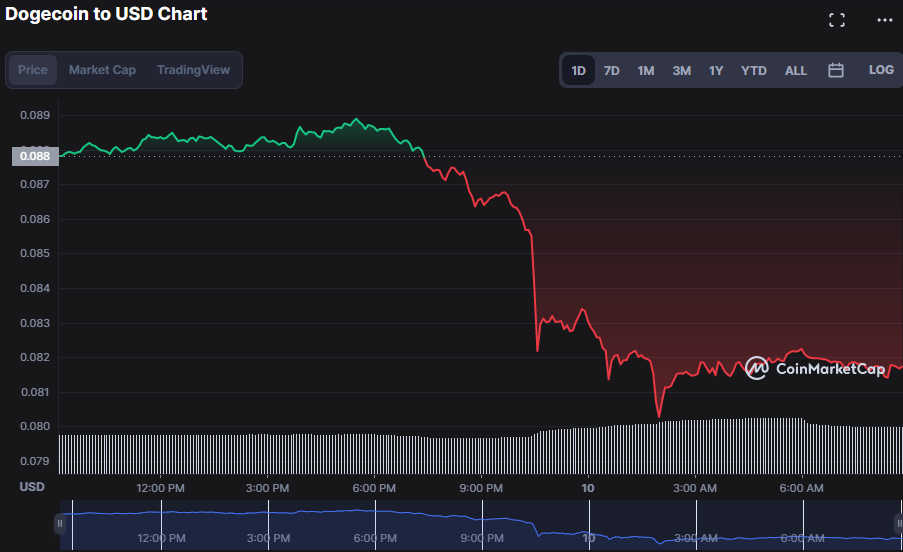
- Bears gain market control as bulls run into resistance at $0.0889.
- On the decline, the DOGE market has found support at around $0.08017.
- Indicators warn traders of a lengthy bear market.
Despite early positive momentum, the Dogecoin (DOGE) market has shifted into a bearish stance. However, the bulls eventually succumbed to the bears after encountering significant resistance at the day’s high of $0.0889. As of press time, the DOGE bears have effectively reduced the price to $0.0819, a 6.85% drop.
The market cap plummeted 6.86% to $10,866,097,615 due to the latest price drop. However, the 19.20% increase in 24-hour trading volume to $708,159,268 suggests that buyers are trying to accumulate Dogecoin at the current levels, which could support DOGE’s price. Furthermore, with the firm buying support at lower levels, the bulls may attempt to capitalize on it and increase the price.
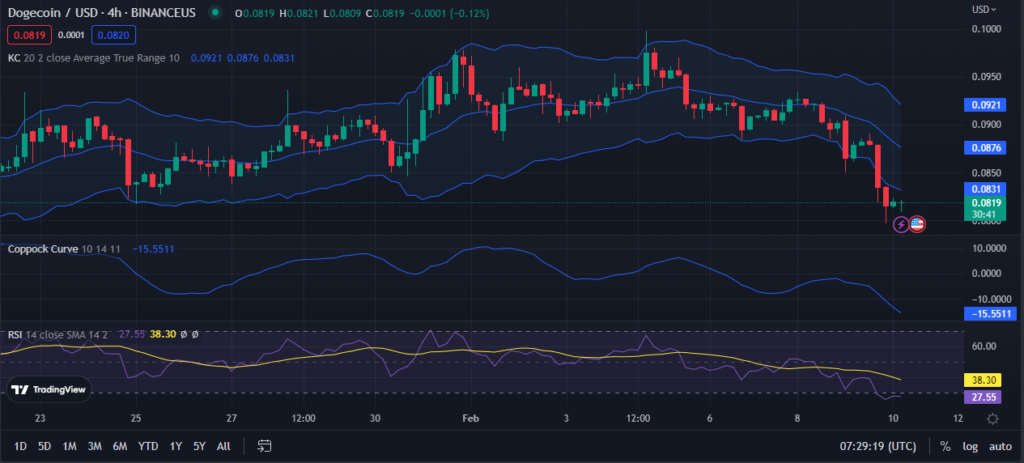
This bearish trend in DOGE, evidenced by the southern movement of the Keltner Channel bands, which now have a southerly crossing of the 0.0921 and 0.0832 levels. With the upper and lower Keltner Channel bands contracting from their previous highs and lows, respectively, this bearish momentum is further supported. By falling below the lower Keltner Channel band, the price sends a negative warning to traders that the price decline may continue.
This gloomy outlook’s persistence is accentuated by the downward slope of the Coppock Curve (-15.5511). This downtrend and movement into the negative territory indicate a market sell-off and a pessimistic price forecast.
Indicating an oversold state in the DOGE market, the RSI is now drifting below its signal line at 27.55. This shift adds fuel to the fire since it suggests that investors are now more inclined to sell than purchase soon, adding to the pessimistic outlook. Consequently, prospective DOGE investors should be wary of the current reading on the Coppock Curve and the oversold RSI.
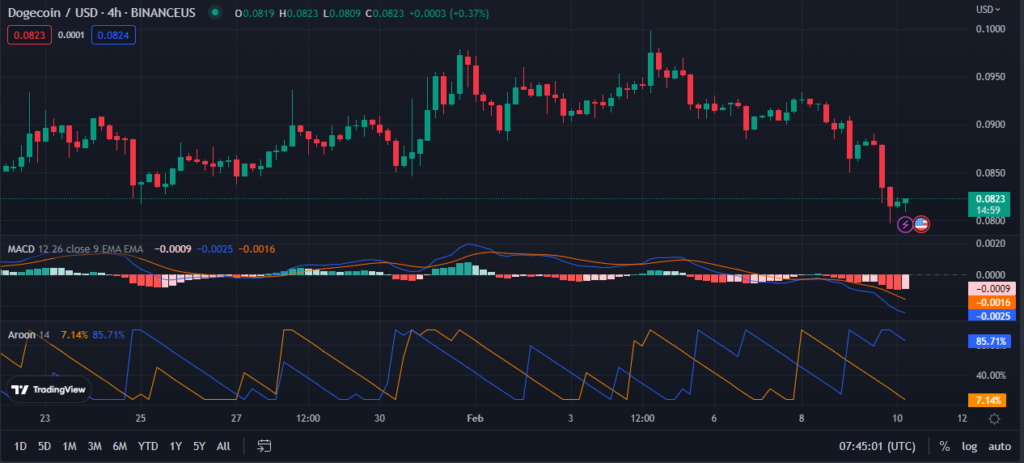
The MACD blue line is trending in the negative territory, at -0.0025, adding weight to the bearish picture. Therefore, the DOGE market may maintain its negative trend for the foreseeable future since there is no evidence to suggest a possible turnaround. Furthermore, the negative trend in the histogram (a value of -0.009) lends credence to this theory.
Since the Aroon up is at 7.14% and the Aroon down is at 85.71%, the DOGE market is very bearish and shows no prospects of reversing soon. As the downtrend is more prominent than the uptrend, a low Aroon up reading suggests a robust negative trend in the market.
Technical indicators show that negative momentum is increasing in the Dogecoin market, indicating a prolonged bear run.
Disclaimer: The views and opinions, as well as all the information shared in this price analysis, are published in good faith. Readers must do their own research and due diligence. Any action taken by the reader is strictly at their own risk, Coin Edition and its affiliates will not be held liable for any direct or indirect damage or loss.
Disclaimer: The information presented in this article is for informational and educational purposes only. The article does not constitute financial advice or advice of any kind. Coin Edition is not responsible for any losses incurred as a result of the utilization of content, products, or services mentioned. Readers are advised to exercise caution before taking any action related to the company.
 Price Prediction: Can BTW Sustain Its Breakout Above $0.1032?")


