






- ETH trades at $1,914.37 on August 19, down 0.12%, retesting a broken triangle trendline near the 100-day EMA
- Ethereum ETFs pulled in $71.47M on August 18, while Bitcoin ETFs posted a $389.71M outflow the week prior
- BitMine now holds 5,815,164 ETH worth roughly $11 billion, part of an $11.4 billion total portfolio disclosed August 17
The Ethereum price prediction turned constructive today, with ETH retesting a confirmed triangle breakout near $1,914 as Fundstrat’s Tom Lee flags that ETH sits just 3.5% below a technical level it hasn’t broken since October 2025.
Ethereum Price Analysis: ETH Breaks Triangle, Retests as Support
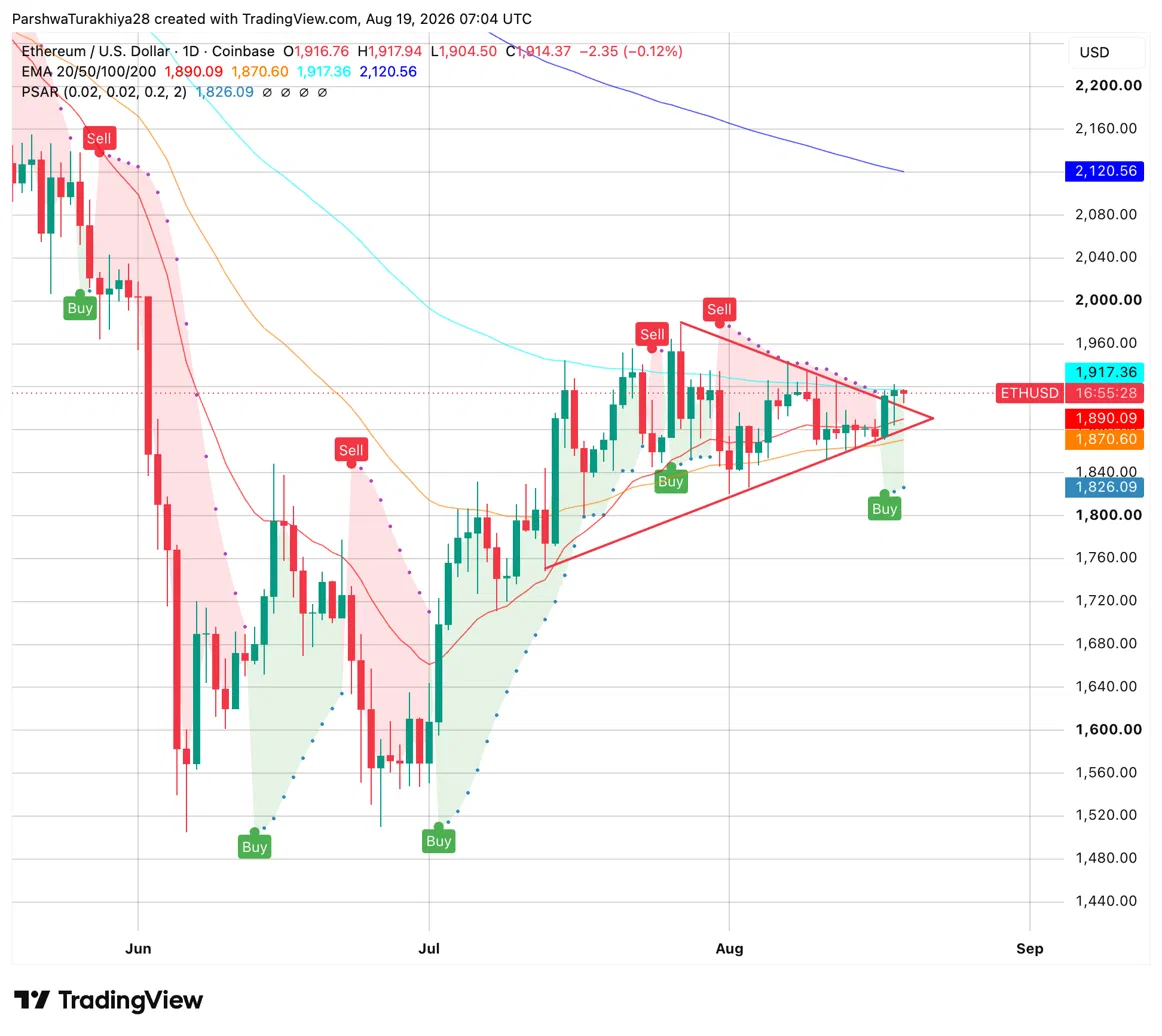
ETH broke above the descending resistance line of a symmetric triangle that’s been building since early July, and price is now retesting that broken trendline as support near $1,900 to $1,920. The 100-day EMA at $1,917.36 sits right in this retest zone, reinforcing it.
The Parabolic SAR at $1,826.09 stays bullish below price, and the 20-day EMA at $1,890.09 and 50-day EMA at $1,870.60 track just underneath as additional support.
Related: Cardano Price Prediction Eyes Reversal As Bullish Divergence Builds On ADA
Holding this retest keeps the breakout intact and opens the path toward $1,970 and then the 200-day EMA at $2,120.56. Losing $1,870 would undo the breakout and expose $1,800.
ETH Support and Resistance Levels, August 19, 2026
| Type | Price | Level |
| Resistance | $1,970 | Prior triangle high |
| Resistance | $2,120.56 | 200-day EMA |
| Support | $1,917.36 | 100-day EMA, retest zone |
| Support | $1,890.09 | 20-day EMA |
| Support | $1,870.60 | 50-day EMA |
| Support | $1,826.09 | Parabolic SAR |
Ethereum News: Tom Lee Flags First Cloud Breakout Since October
Tom Lee said Ethereum’s tailwind over the next few years is larger than what drove prior cycles built around ICOs and NFTs, and that he expects the ETH to BTC ratio to make a sizable move higher from here. The comment came in response to BitMine, the company he chairs, disclosing $11.4 billion in total holdings on August 17, including 5,815,164 ETH valued at $1,893 per coin.
Lee also weighed in on ETH’s technical setup, replying to a post from analyst CRG noting that ETH is trading roughly 3.5% below the upper edge of its daily Ichimoku cloud, a zone it hasn’t closed above since October 9, 2025. Lee said seeing that breakout play out “would be good to see.”
Separately, analyst CW8900 flagged that high leverage ETH positions clustered around $1,850 and $1,950 have been growing larger, marking both levels as zones where a sharp move could trigger forced liquidations in either direction.
CW8900 also pointed to ETH being capped at the point of control on the daily chart, a price level where the most trading volume has occurred and which often acts as a magnet or barrier for price. Even a break above that level leaves another resistance wall at $2,276, and CW8900 said clearing both would be enough to push ETH into a full blown bull market.
Ethereum Derivatives: Volume Cools as Traders Stay Net Long
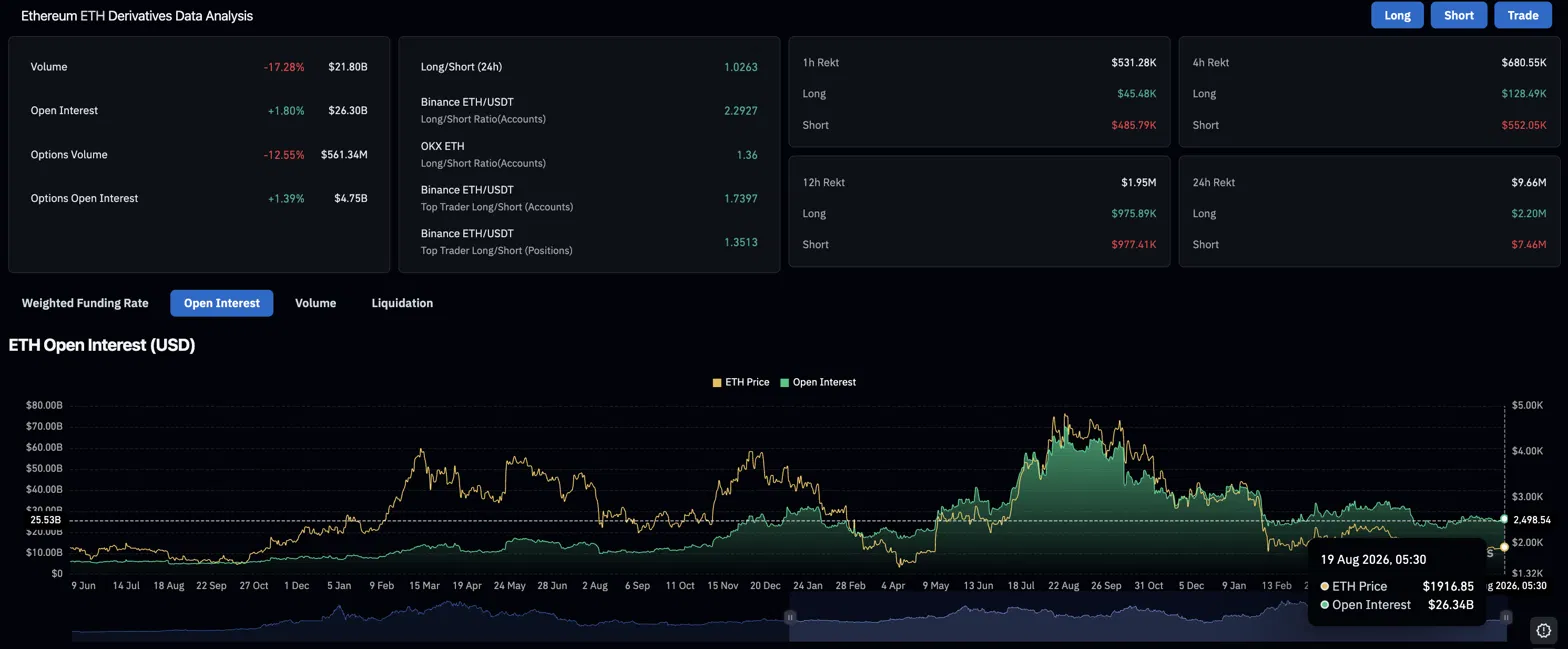
Ethereum’s derivatives volume fell 17.28% to $21.80B over the past 24 hours, showing trading activity cooled off a bit. Open interest, the total money locked into open positions, still edged up 1.80% to $26.30B, meaning fewer trades happened but positions held steady.
Traders are leaning bullish. Binance shows 2.29 long positions for every short, and OKX shows 1.36, meaning more money is betting on ETH rising than falling.
| Metric | Value | What it shows |
| Derivatives volume (24h) | $21.80B, down 17.28% | Trading activity cooled off |
| Open interest | $26.30B, up 1.80% | Positions held steady |
| Binance long/short ratio | 2.2927 | Traders heavily favor a price rise |
| OKX long/short ratio | 1.36 | Same bullish lean |
That bullish lean shows up in liquidations too, when leveraged bets get force closed after price moves against them. Of the $9.66M wiped out in the past 24 hours, $7.46M came from short sellers caught out as price held up, while longs lost just $2.20M. Shorts kept taking the bigger hit on shorter timeframes as well, both over the last 4 hours and the last hour, showing sellers are still getting squeezed as ETH holds its breakout.
Ethereum News: ETF Inflows Hold Steady While Bitcoin Funds Bleed
Ethereum ETFs pulled in $71.47M on August 18, led by BlackRock’s ETHA with $64.68M, pushing cumulative net inflow to $11.56B. That single day figure alone topped the prior full week, when ETH ETFs added just $102.32M between August 15 and August 18, a number still building with three trading days left before the week closes.
Related: KiiChain Price Prediction: Can KII Break $0.07141 Amid Rising Market Activity?
The contrast with Bitcoin has been stark. Bitcoin ETFs posted their worst week since early July during the week ending August 14, losing $389.71M in net outflows, while Ethereum’s ETFs stayed roughly flat that same week at negative $2.26M before rebounding sharply this week. Total net assets across Ethereum ETFs now sit at $10.83B.
ETH Price Prediction: Upside and Downside Targets
Bullish Case, Target: $2,120.56 (200-day EMA)
ETH holds the $1,900 to $1,917 retest zone and closes above its daily Ichimoku cloud for the first time since October 2025, confirming the breakout Tom Lee flagged. Continued ETF inflow momentum and heavy short liquidations add fuel to the move, while the Parabolic SAR staying bullish keeps short term trend support intact. Clearing $1,970 opens the path toward the 200-day EMA at $2,120.56.
Bearish Case, Risk Level: $1,800
ETH loses the retest zone and closes back below the 50-day EMA at $1,870.60, undoing the triangle breakout. Leverage building at $1,850 gets tested and unwinds sharply, and ETF inflows fail to sustain this week’s pace once the full week’s data comes in. Price falls back toward the $1,800 zone, retesting the lower half of the prior triangle’s range.
Conclusion
ETH’s setup right now has more supporting signals pointing the same direction than most breakout retests do. The triangle breakout, the Ichimoku cloud test Tom Lee is watching, the ETF inflow surge, and the short-heavy liquidations are all independent data points, and all four currently favor the bulls.
The $1,900 to $1,917 retest zone is still the level that has to hold for that alignment to matter, though; breakouts fail on retests more often than headlines suggest, and losing $1,870 would undo the entire structure regardless of how strong the fundamental case looks on paper.
FAQs
ETH trades at $1,914.37, retesting a confirmed triangle breakout. The bullish target is $2,120.56 at the 200-day EMA, while the bearish risk level is $1,800 if the $1,900 to $1,917 retest zone fails.
He replied “would be good to see” to a post noting ETH is trading about 3.5% below the level needed for its first Ichimoku cloud breakout since October 9, 2025.
BitMine, the company Tom Lee chairs, disclosed 5,815,164 ETH worth roughly $11 billion on August 17, part of an $11.4 billion total portfolio.
Ethereum ETFs pulled in $71.47 million in a single day, more than their entire prior week combined, while Bitcoin ETFs were still recovering from a $389.71 million outflow week, a clear near-term divergence in investor demand between the two assets.
ETH is showing a genuinely constructive setup right now, with a confirmed breakout, strong ETF demand, and short sellers absorbing the bulk of recent liquidations, but the retest zone still needs to hold to confirm it. This is not financial advice, so weigh the bullish and bearish cases above against your own research and risk tolerance.
Disclaimer: The information presented in this article is for informational and educational purposes only. The article does not constitute financial advice or advice of any kind. Coin Edition is not responsible for any losses incurred as a result of the utilization of content, products, or services mentioned. Readers are advised to exercise caution before taking any action related to the company.




