


- Crypto trader tweeted that $0.07032 was a key support for DOGE and 0.065 was the threshold of losing momentum.
- RSI and PVT indicators denote that DOGE is on a strong trend; DOGE may make its first higher high for 2023.
- DOGE seeks support from the 3:1 Gann line which catapulted DOGE to high prices. It may catapult DOGE once more.
Crypto trader and investor Elizy tweeted that $0.07032 was a key support level for Dogecoin. In the analysis, it could be seen that Dogecoin was making lower highs being subjective to the trend line. As per Elizy’s view, since the $0.07032 support level is a key point, Dogecoin could rise if the bulls manage to defend this support level.
However, another Twitter user raised a counter-argument against Elizy’s view and stated that the key support for Dogecoin was a bit lower than Elizy’s support. Nonetheless, Elizy who was strong in his opinion replied to the tweet saying that Dogecoin could lose momentum once it crosses $0.065, and will crash by a huge margin.
DOGE is exchanging hands at $$0.07043, at press time after experiencing an increase of 1.68% within the last 24 hours. Notably, the 24-hour trading volume rose by 52.51% to $429,923,492.
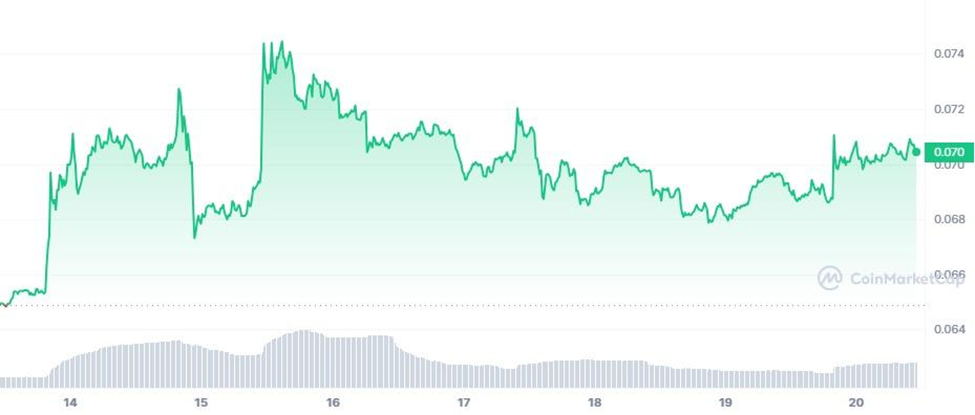
The chart above shows how DOGE has been trading in the green zone since the beginning of the week. On July 14 and 15, DOGE made higher highs and reached a maximum price of $0.07445. However, this rally was short-lived as DOGE started to lower high from July 16 until late July 19. But with the dawn of the next day, the meme coin seems to have gained some momentum as the bulls seem to be fighting back.
When considering the chart above, DOGE is making lower highs on a macro level as correctly highlighted by Elizy. The RSI in the chart reads a value of 57.84, which means the trend is strong. Moreover, the RSI line is rising, as such, DOGE may keep on rising.
The Price Volume Trend indicator reads a value of 626B and the line is slightly rising towards the upward direction, which denotes that the strength of the trend is rising. As such, the PVT complements the PVT indicator.
Moreover, the budding green candlestick could be the beginning of bull activity. If the bulls take over the market, DOGE could break above the upper trend line and reach Resistance 1 at $0.95.
When considering the shorter time frame for DOGE, it is currently supported by the 3:1 Gann line. The preceding support level has acted as a launch pad for DOGE. As such, this time too DOGE could reach the 2:1 Gann line if the bulls defend the 3:1 Gann line, However in the event the 3:1 Gann line is breached, DOGE may seek support from the 4:1 Gann line.
Disclaimer: The views, opinions, and information shared in this price prediction are published in good faith. Readers must do their research and due diligence. Any action taken by the reader is strictly at their own risk. Coin Edition and its affiliates will not be liable for direct or indirect damage or loss.
Disclaimer: The information presented in this article is for informational and educational purposes only. The article does not constitute financial advice or advice of any kind. Coin Edition is not responsible for any losses incurred as a result of the utilization of content, products, or services mentioned. Readers are advised to exercise caution before taking any action related to the company.
 Price Prediction 2026, 2027, 2028, 2029, 2030-2050")
 Price Prediction 2026, 2027, 2028, 2029, 2030-2050")


