


- Ali observed a descending triangle pattern forming on the DOGE one-week chart.
- The DOGE/USDT 1-Day Chart shows a falling wedge pattern could be forming.
- DOGE’s three-digit spike and five-digit could be caused by the trader’s interests.
A crypto analyst under the pseudonym Ali observed a descending triangle pattern forming on the DOGE one-week chart. The crypto analyst also pointed out that DOGE experienced a 23,200% surge last time a descending triangle pattern formed. Currently, Ali speculated that if DOGE closes above $0.80, then, there may be a chance that the bullish surge could happen once again.
Looking at the DOGE/USDT 1-Day Chart, the candlesticks could be forming a falling wedge pattern. This could be deduced by observing the lower highs and lower lows that are continuously forming over time. Moreover, the 200 SMA and the trendline could converge soon, creating a strong resistance level for DOGE.
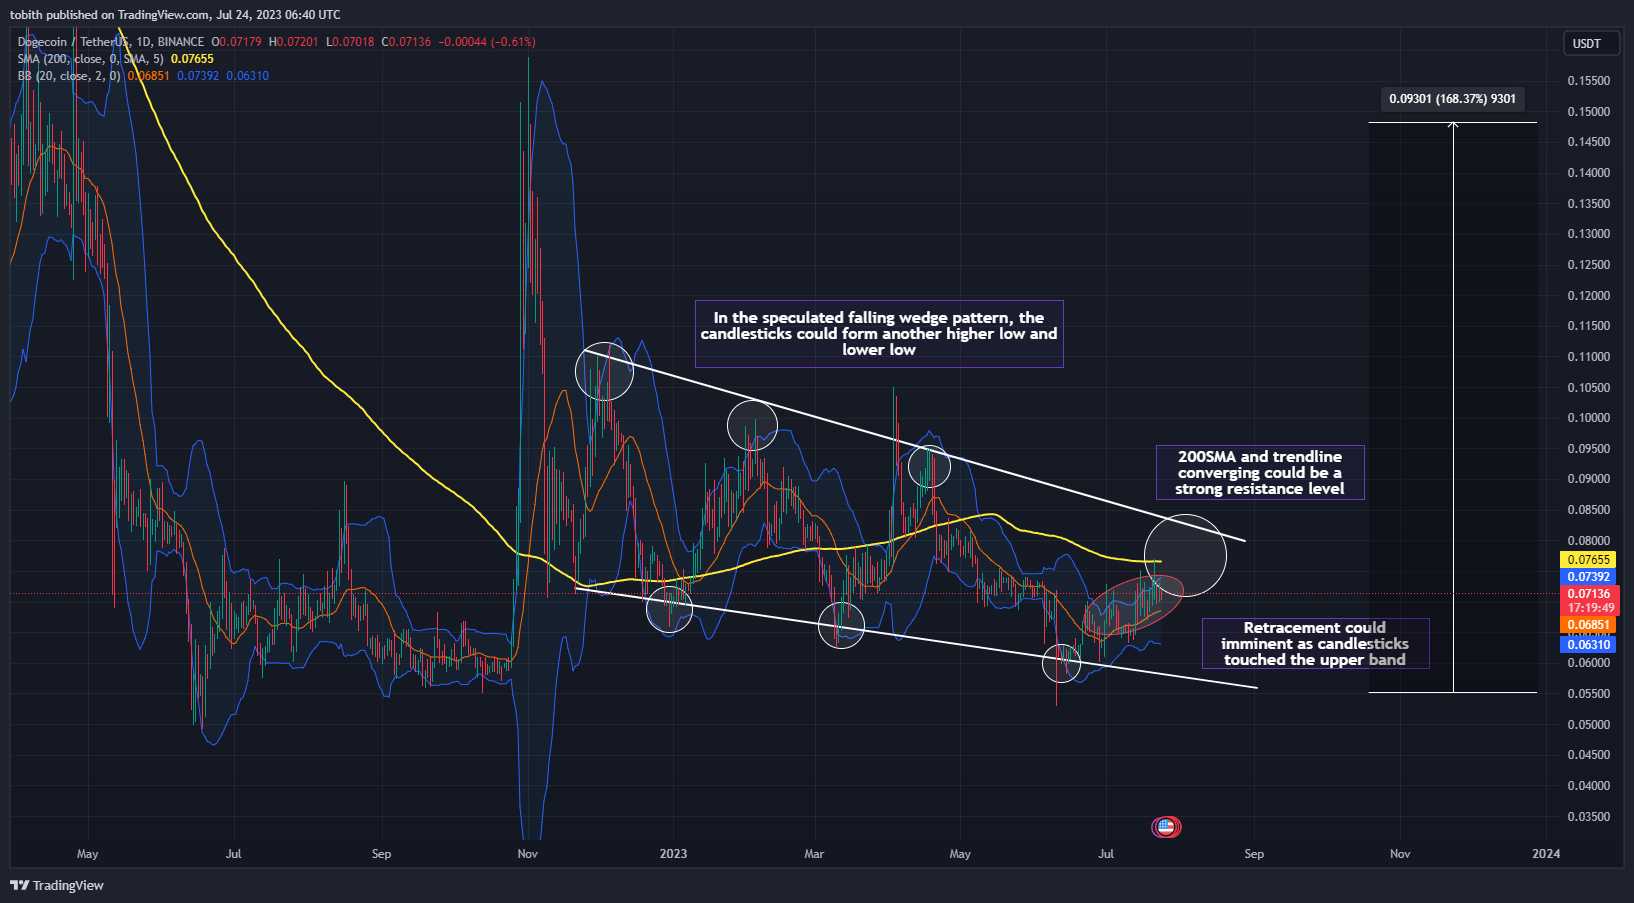
The Bollinger Bands indicator shows that the candlesticks are currently testing the upper band, which could be considered that the DOGE market has excess buyers. With excess buyers in the market, DOGE could witness a price correction soon. If the hypothesis of DOGE may be forming a falling wedge pattern is true, then, a new lower low could be formed during its price retracement adventure.
Furthermore, there is a slight chance that DOGE may break out beyond its current resistance level, which is at the 200SMA. In this scenario, DOGE could also fall back again as the meme coin may be trading in the overbought market based on the Bollinger Bands indications.
The falling wedge pattern could create an entry into a bullish market, experiencing a surge. Observing the previous price level, DOGE needs to experience a 168.37% surge over time to reach this previous level. The three-digit surge could enable DOGE to reach the $0.1500 level.
However, meme coins could ignore the fundamental rules of technical analysis and their price could be driven by traders’ interests and psychological factors. Hence, traders should note that the three-digit spike and the five-digit surge could be caused by the market’s interest and through large amounts of buyers’ entries.
Disclaimer: The views and opinions, as well as all the information shared in this price analysis, are published in good faith. Readers must do their own research and due diligence. Any action taken by the reader is strictly at their own risk, Coin Edition and its affiliates will not be held liable for any direct or indirect damage or loss.
Disclaimer: The information presented in this article is for informational and educational purposes only. The article does not constitute financial advice or advice of any kind. Coin Edition is not responsible for any losses incurred as a result of the utilization of content, products, or services mentioned. Readers are advised to exercise caution before taking any action related to the company.
 Price Prediction: Can BTW Sustain Its Breakout Above $0.1032?")


