


- KALEO predicted in a tweet today that DOGE may strengthen against BTC in the next few days.
- At press time, DOGE was up 2.74% against the leading cryptocurrency.
- A symmetrical triangle had formed on the daily chart for DOGE/BTC, which suggested that a breakout may soon take place.
The trader and analyst KALEO revealed in a tweet earlier today that the trading pair for Dogecoin (DOGE) and Bitcoin (BTC) is starting to move again. In the post, he predicted that DOGE may strengthen against the market leader in the coming few days.
Meanwhile, at press time, the meme coin was up 2.54% over the past 24 hours according to CoinMarketCap. On the other hand, BTC was down 0.37%. As a result, the largest meme coin was trading at $0.07609 and BTC’s price stood at $29,039.63.
This meant that DOGE had already started strengthening against BTC by 2.74% over the past 24 hours. Subsequently, 1 DOGE was worth 0.000002621 BTC at press time.
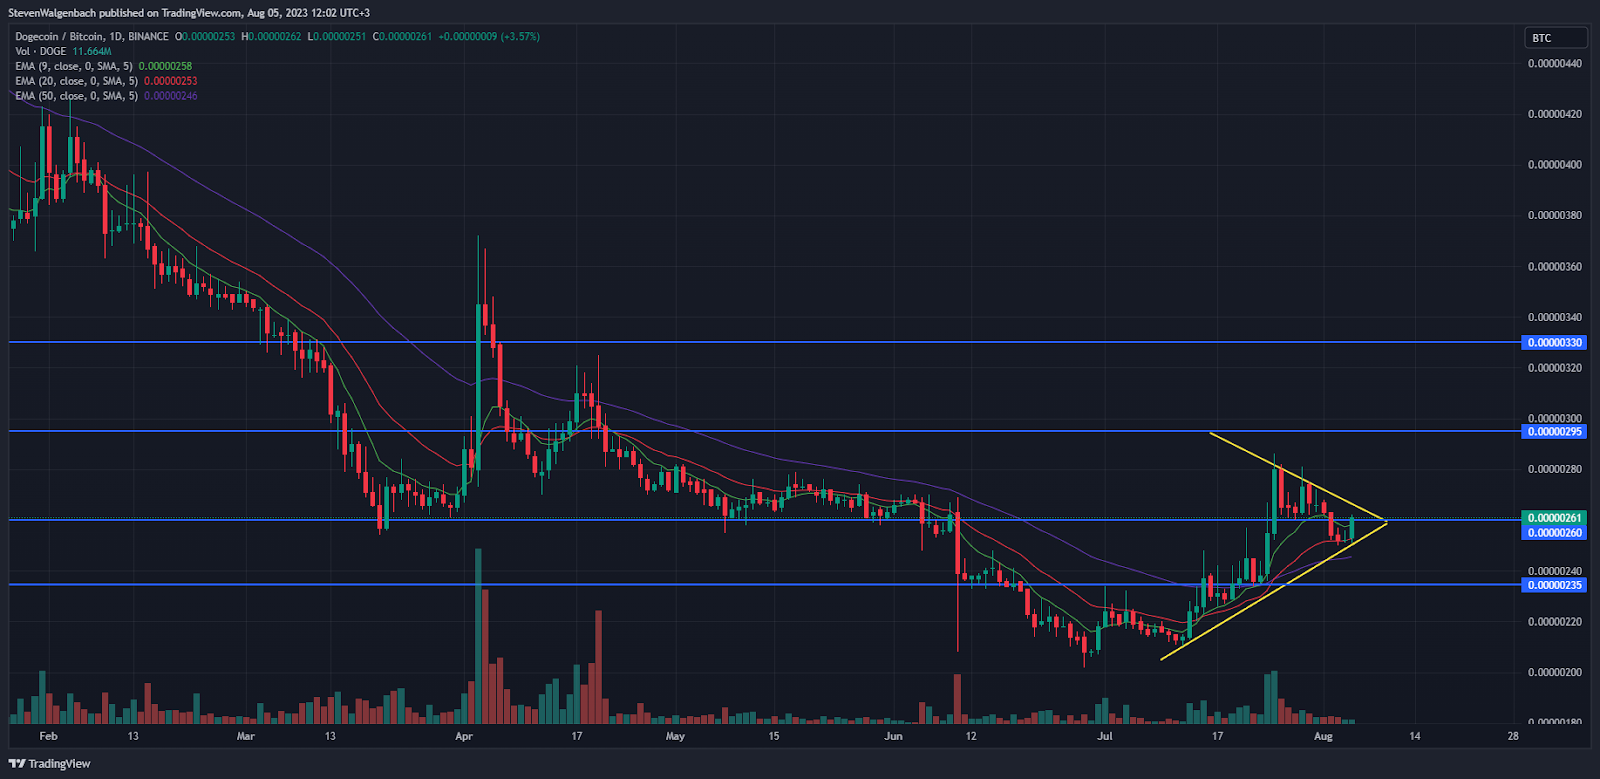
Looking at the daily chart for BOGE/BTC, a symmetrical triangle had formed on the chart. This pattern suggested that DOGE may break out against BTC in the coming few days. If this breakout is towards the upside, DOGE could look to flip the resistance at 0.00000260 BTC into support. Should this happen, DOGE/BTC could rise to 0.00000295 in the upcoming week.
Conversely, if DOGE/BTC is rejected by the 0.00000260 BTC resistance level then it may be at risk of dropping to the 20-day EMA line at around 0.00000253 BTC. If DOGE loses the support of this technical indicator, its last line of defense before it plummets to 0.00000235 will be the 50-day EMA line at 0.00000246 BTC.
Technical indicators suggested that momentum was in favor of bulls at press time. The 9-day EMA line was positioned above the 20-day EMA line. This indicated that DOGE/BTC was in a short-term bullish cycle. In addition to this, the 20-day EMA line was also positioned above the 50-day EMA line, which suggested that medium-term momentum was positive as well.
Disclaimer: The views and opinions, as well as all the information shared in this price analysis, are published in good faith. Readers must do their own research and due diligence. Any action taken by the reader is strictly at their own risk. Coin Edition and its affiliates will not be held liable for any direct or indirect damage or loss.
Disclaimer: The information presented in this article is for informational and educational purposes only. The article does not constitute financial advice or advice of any kind. Coin Edition is not responsible for any losses incurred as a result of the utilization of content, products, or services mentioned. Readers are advised to exercise caution before taking any action related to the company.


