





- Futures volume exploded 242.91% to $460.38M with OI up 13.39% as shorts absorbed $560.71K in 24-hour liquidations.
- HBAR spiked from $0.082 to $0.095 on the 2-hour chart breaking above the upper Bollinger Band with MACD crossing bullish.
- Daily CMF at 0.08 confirms positive money flow while price presses the 0.618 Fib at $0.0948 as immediate resistance.
Hedera trades at $0.09237 on May 29, bouncing sharply off $0.082 lows in one of its biggest single-session volume days in months, as futures positioning flips bullish and the 2-hour chart breaks out of a tight Bollinger Band squeeze.
HBAR Daily and 2-Hour Chart: Fib Cluster at $0.095 Is the Only Wall Between Here and $0.10
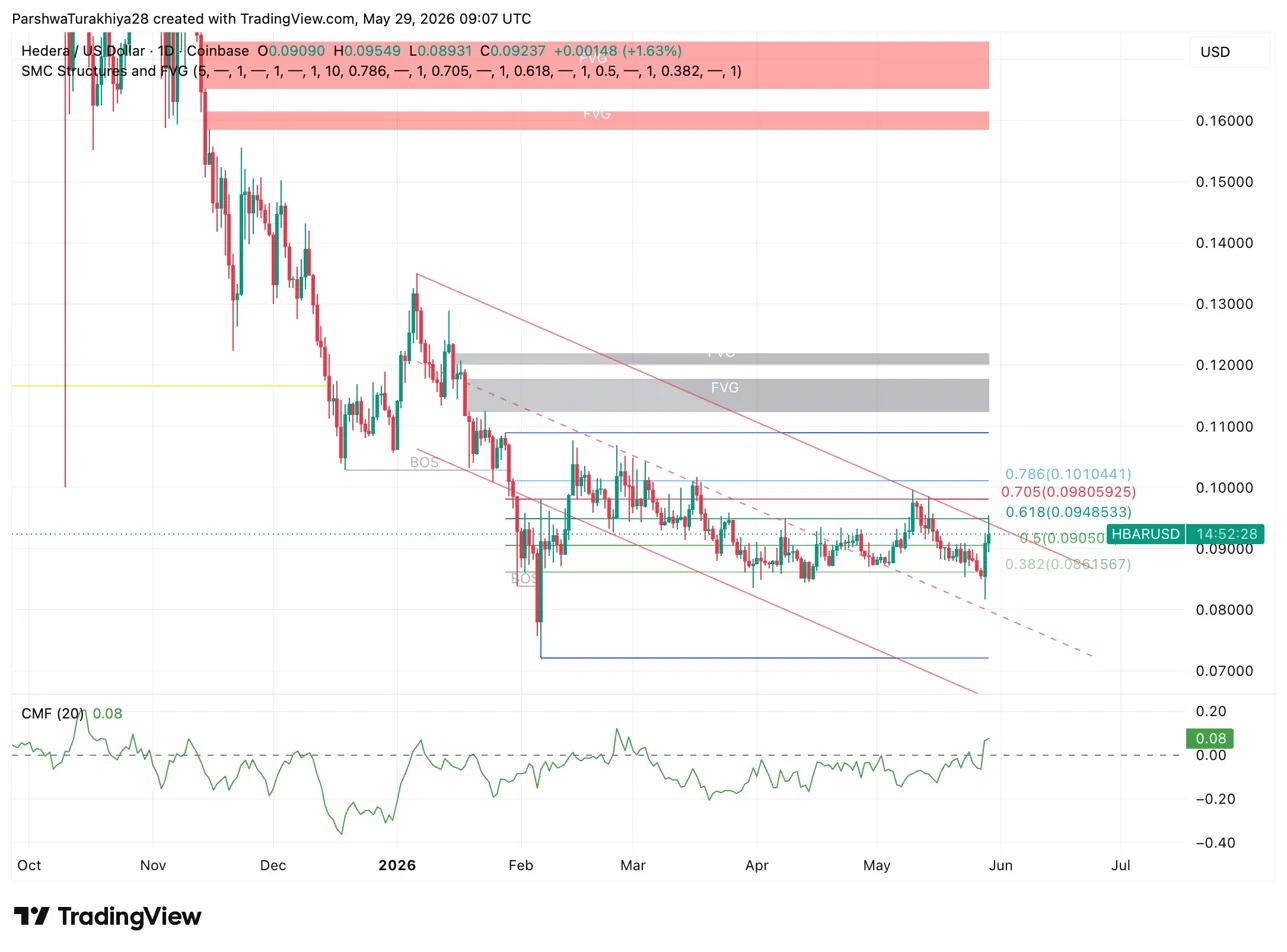
The daily chart has been compressing inside a descending channel since January, with price grinding between the 0.382 Fib at $0.0861 and the 0.5 Fib at $0.0905. Two FVG zones sit overhead between $0.1150 and $0.1250, both untouched since the February breakdown. The CMF at 0.08 is positive and rising, confirming buyers are entering rather than exiting positions at current prices.
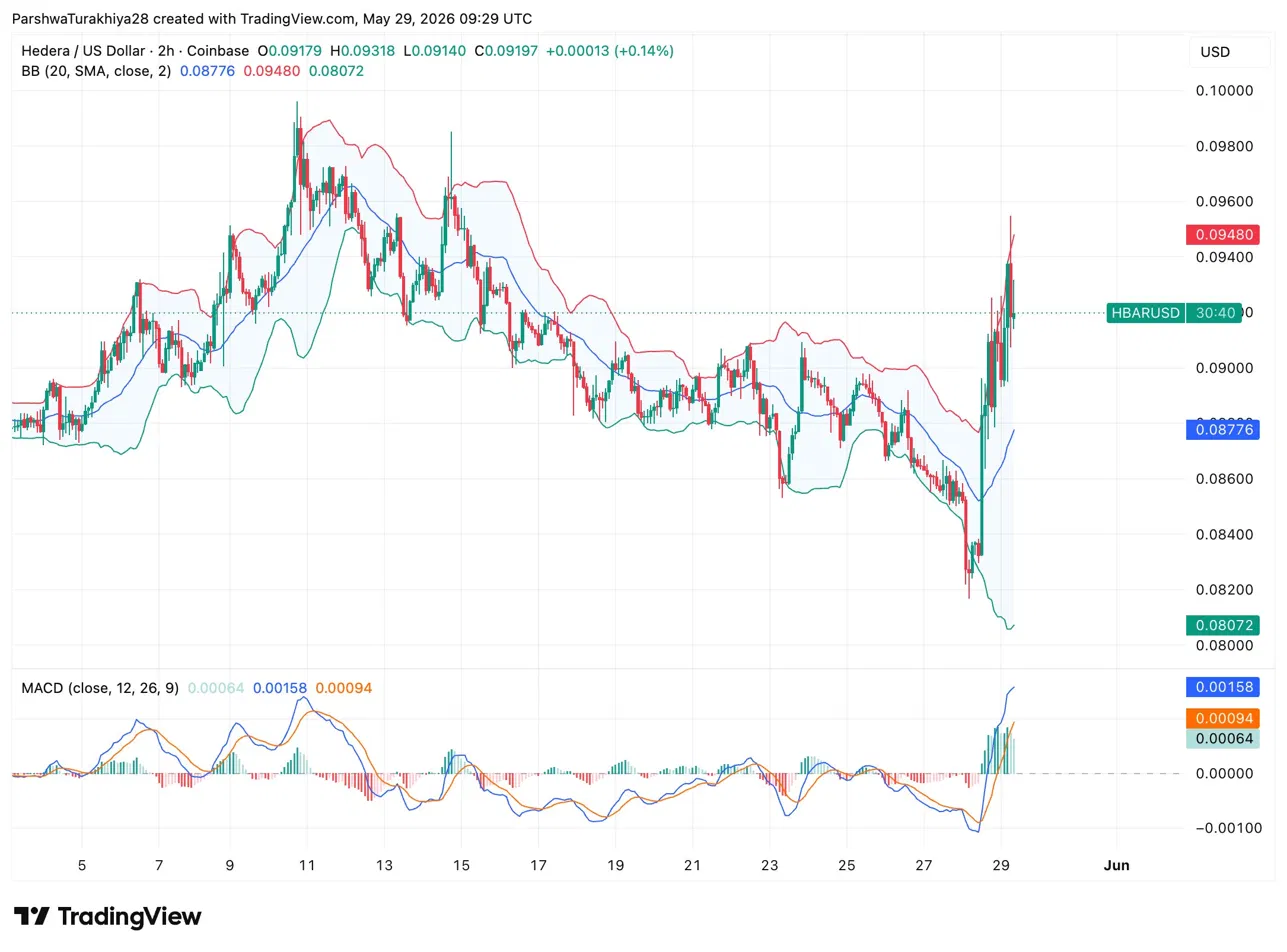
Dropping to the 2-hour chart, the move is cleaner. Price was compressing inside narrowing Bollinger Bands from May 23 through May 28 with the lower band at $0.08072 and the upper at $0.09480. Today’s candle broke above the upper band, the classic Bollinger Band squeeze breakout signal. The MACD crossed bullish with the line at 0.00158 above the signal at 0.00094, both above zero and widening.
The 0.618 Fib at $0.09485 sits exactly at the upper Bollinger Band, making it a double resistance point. A 2-hour close above $0.09485 opens a run toward the 0.705 Fib at $0.09805 and then the 0.786 at $0.10104. On the downside, the Bollinger Band midline at $0.08776 is the first support on any pullback, with the 0.5 Fib at $0.0905 acting as secondary support.
HBAR Key levels for May 30:
- Resistance: $0.09485 (0.618 Fib and upper BB), $0.09805 (0.705 Fib), $0.10104 (0.786 Fib)
- Support: $0.08776 (BB midline), $0.0905 (0.5 Fib), $0.0861 (0.382 Fib)
HBAR Futures: Volume Tripled and Shorts Are Paying the Price
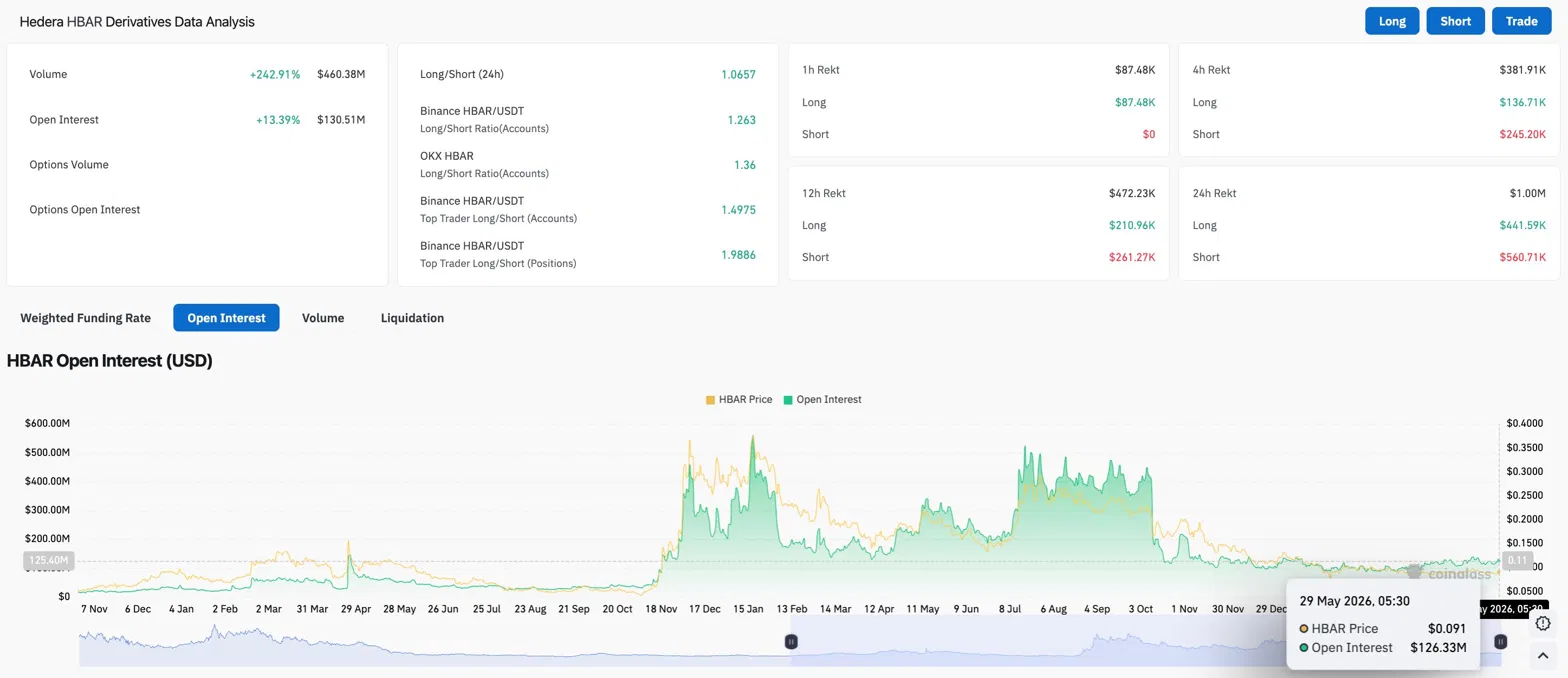
Futures volume surged 242.91% to $460.38M while open interest climbed 13.39% to $130.51M. Volume tripling while OI rises modestly means short-term speculation is driving most of the activity, but the liquidation data tells the real directional story. Shorts absorbed $560.71K in 24-hour liquidations against $441.59K for longs, bears are losing the futures battle.
The retail long/short ratio sits at 1.0657, nearly even. Top traders on Binance are running 1.4975 by accounts and 1.9886 by positions, meaning professionals are sizing long positions nearly twice the size of their shorts.
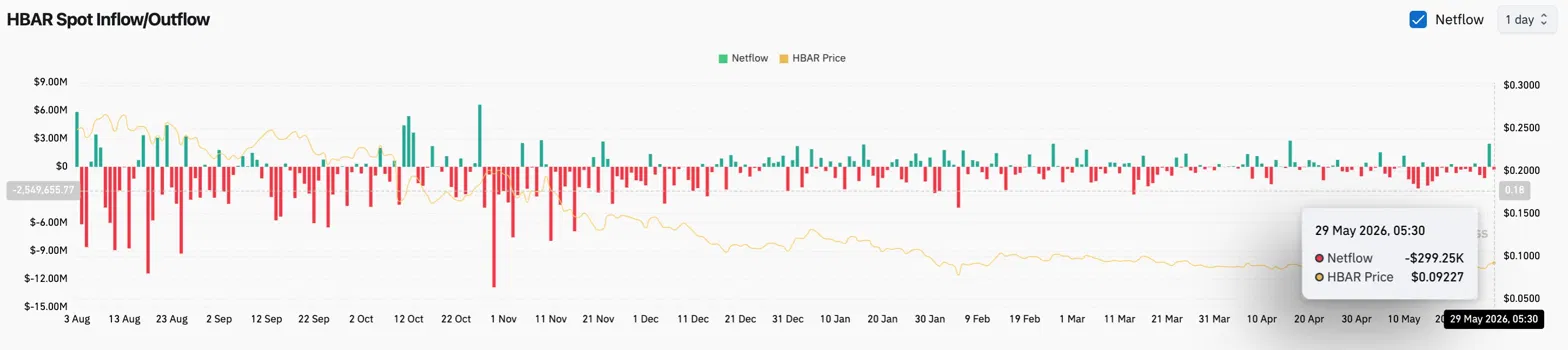
Moreover, spot netflow on May 29 sits at negative $299.25K, a mild outflow that has not stopped the price recovery, suggesting futures positioning is driving the move rather than spot accumulation.
HBAR Price Prediction for May 30
- Upside: Closing above $0.09485 on the 2-hour chart targets the 0.705 Fib at $0.09805 first, then the 0.786 at $0.10104 where the round number and prior structure converge.
- Downside: Losing the BB midline at $0.08776 on a 2-hour close puts the 0.382 Fib at $0.0861 back in play, with the channel lower trendline near $0.082 as the worst-case floor.
Disclaimer: The information presented in this article is for informational and educational purposes only. The article does not constitute financial advice or advice of any kind. Coin Edition is not responsible for any losses incurred as a result of the utilization of content, products, or services mentioned. Readers are advised to exercise caution before taking any action related to the company.




