


- DOGE gained as much as 15% in the last seven days while SHIB consolidated.
- Additionally, DOGE’s volume pressure increased, and the price could reach $0.08249.
- SHIB’s upward momentum was weak, signaling a possible decline in price.
Dogecoin (DOGE) and Shiba Inu (SHIB), the two prominent meme cryptocurrencies, are at crossroads as their next targets could lead them on diverging paths. For DOGE, it has been a rollercoaster ride to $0.08, thanks to a 15.52% gain in the last seven days.
SHIB, on the other hand, hasn’t been so lucky. According to CoinMarketCap, SHIB’s 7-day performance was a mild 1.58% increase.

Dogecoin (DOGE)
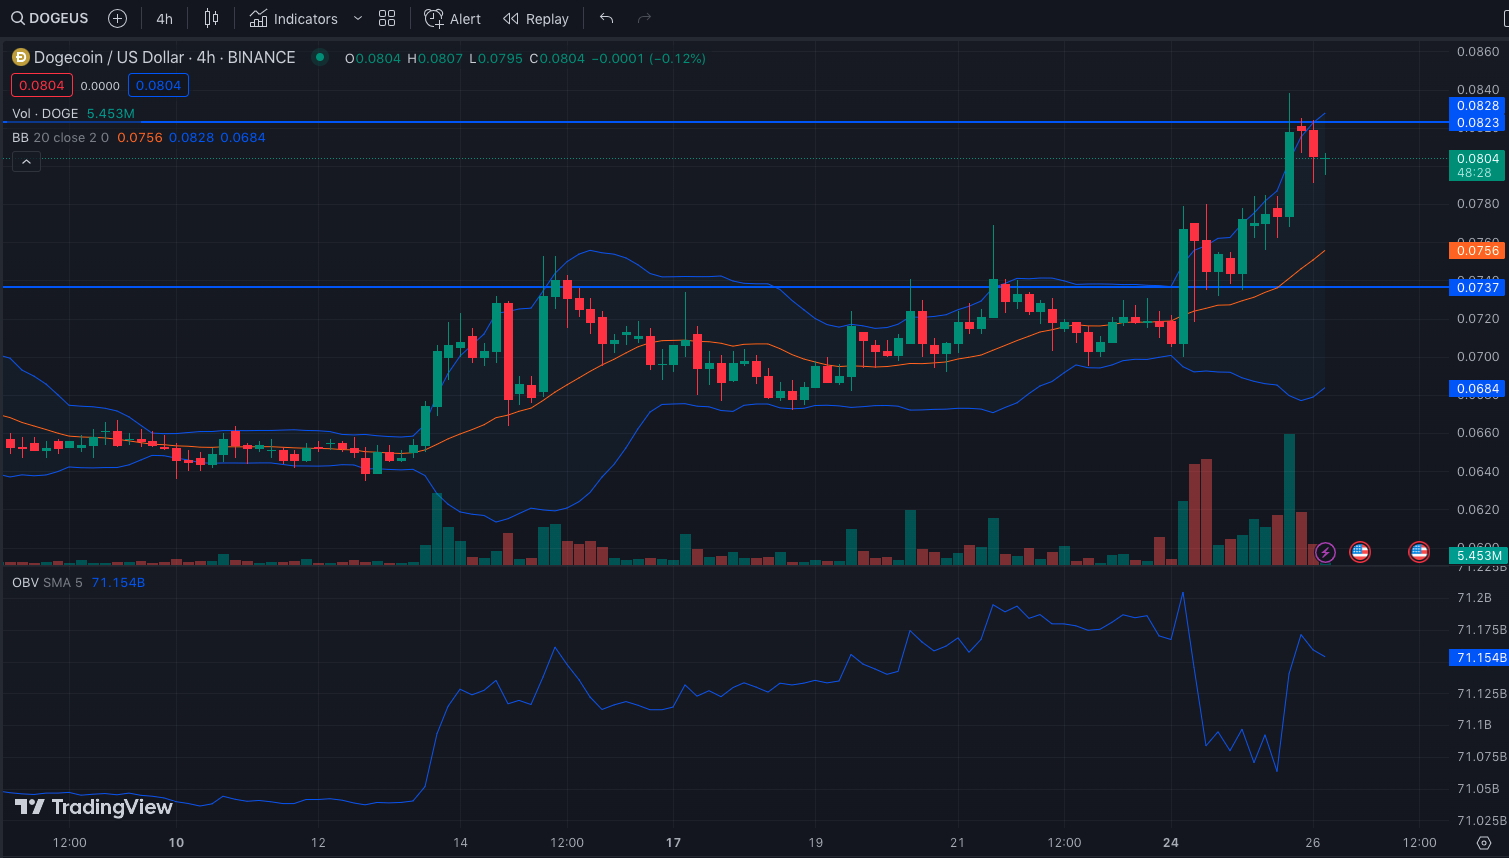
While DOGE exchanged hands at $0.080, crypto analyst Michaël van de Poppe tweeted that the meme’s next targets could be between $0.08074 and $0.08249.
Currently, Dogecoin’s volatility has reached extreme levels, as indicated by the Bollinger Bands (BB). But as of this writing, DOGE’s upward trend has been met with selling pressure at $0.082.
Then, with the upper band of the BB touching the DOGE price, the coin could be pegged back to the previous support at $0.0737.
But if DOGE retraces, the decline may only last a short while because of the On-Balance Volume (OBV). At press time, the OBV had increased to 71.15 billion. If the OBV had decreased, then it would reflect negative volume pressure that would trigger lower prices. But since DOGE’s OBV increased, it means that the volume pressure was positive. Hence, DOGE could hit higher prices at $0.08084 and $0.08249.
Shiba Inu (SHIB)
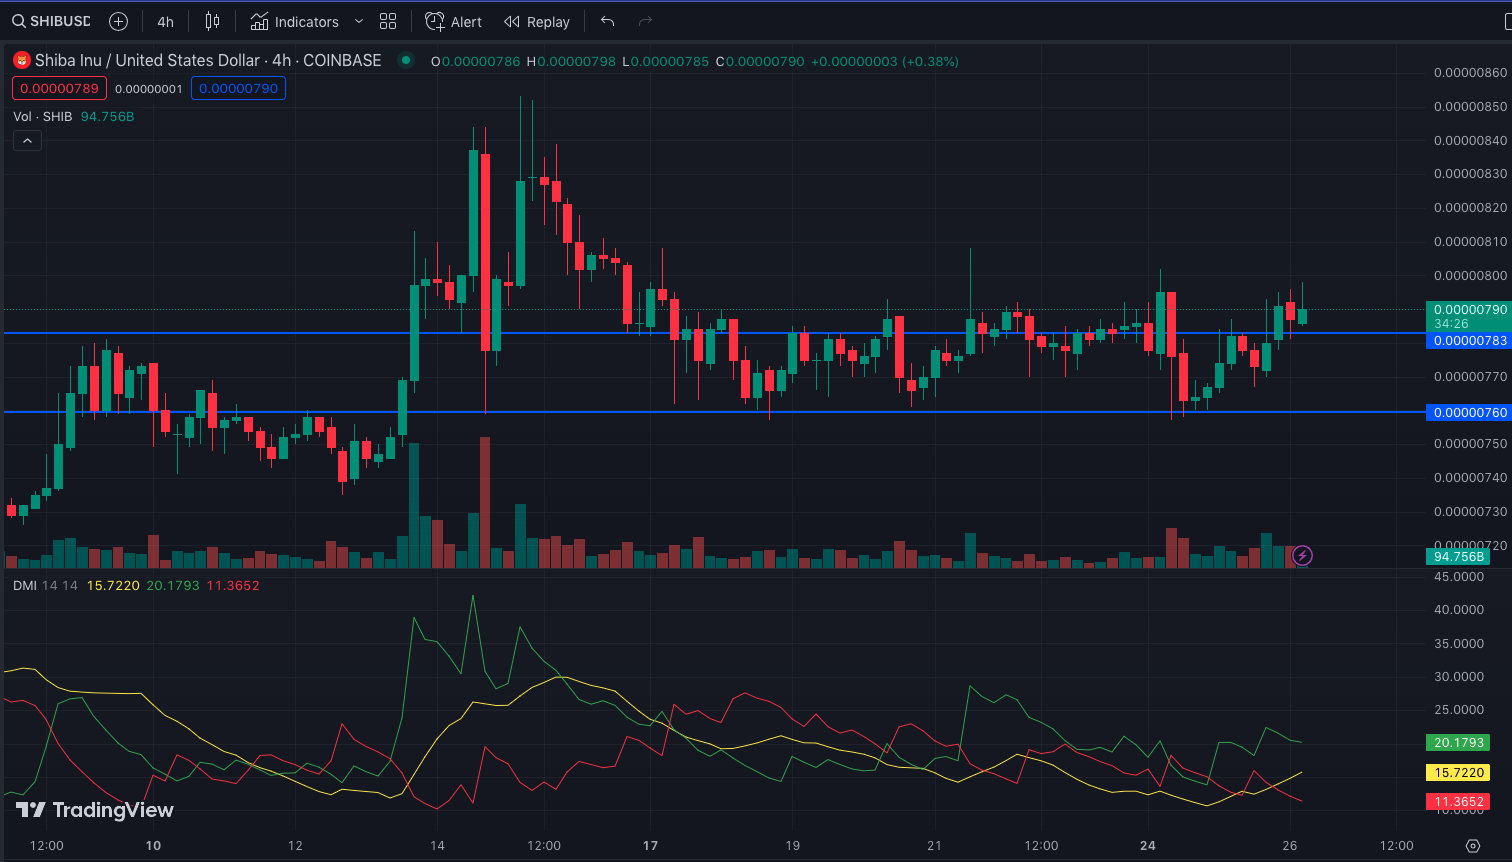
In the 4-hour SHIB/USD corner, the upward trend was met with resistance at $0.00000789. As it stands, the demand which appeared at $0.00000760 has been neutralized.
Furthermore, indications from the Directional Movement Index (DMI) showed that SHIB’s upward momentum has no strength behind it. At the time of writing, the +DMI (green) was 20.17. On the other end, the – DMI (red) was 11.36. The difference between these indicators shows how buyers had previously had more control over the market than sellers.
However, the Average Directional Index (ADX) displayed how weak buying authority is. At press time, the ADX (yellow) was 15.72. Usually, when the ADX is 25 or above, it depicts a solid directional strength.
But when the ADX falls below 25, it signals a weak directional strength. The latter was the case for SHIB.
Going forward, DOGE has the potential to rise above $0.082. However, SHIB’s most likely destination could be a further decrease in its price.
Disclaimer: The views, opinions, and information shared in this price prediction are published in good faith. Readers must do their research and due diligence. Any action taken by the reader is strictly at their own risk. Coin Edition and its affiliates will not be liable for direct or indirect damage or loss.
Disclaimer: The information presented in this article is for informational and educational purposes only. The article does not constitute financial advice or advice of any kind. Coin Edition is not responsible for any losses incurred as a result of the utilization of content, products, or services mentioned. Readers are advised to exercise caution before taking any action related to the company.


