





- TD Sequential buy signals fired simultaneously on DOGE’s monthly, weekly, 3-day, and daily charts, a rare multi-timeframe alignment per Ali Charts
- DOGE is down 43% from its May high and retesting the same demand zone for the third time, with the lower Bollinger Band at $0.06881 as the floor
- August has a -5.17% median return for DOGE across thirteen years, the second worst seasonal month in its calendar
Dogecoin trades at $0.06961 on July 31, down 1.30%, retesting a demand zone that has held since the June lows as TD Sequential buy signals fire simultaneously across four timeframes for the first time in recent memory.
DOGE Is Retesting The Demand Zone With Every EMA Above As Resistance
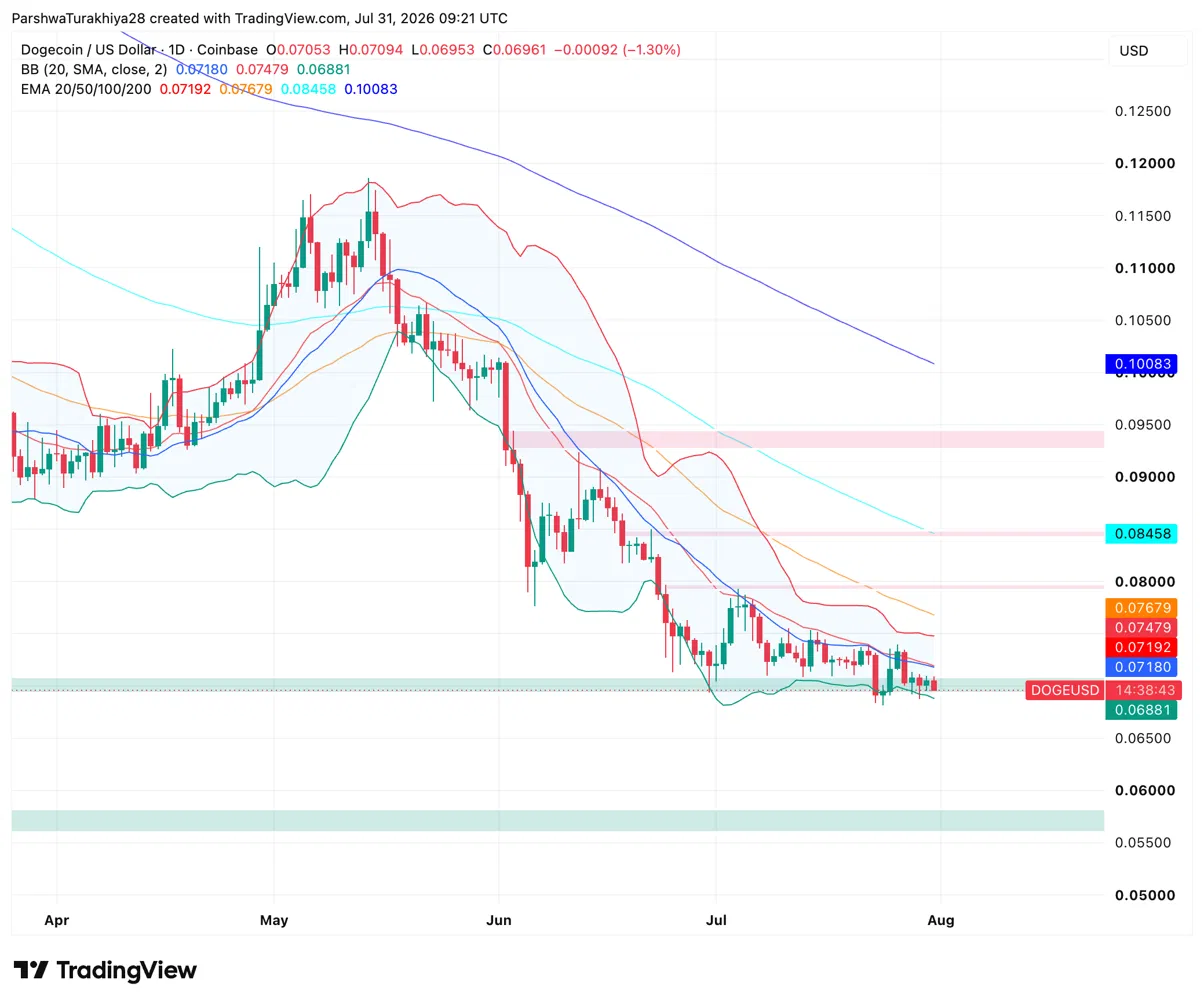
DOGE is pressing against the lower Bollinger Band at $0.06881, inside a demand zone that has held through two prior tests since the June lows. This is the third test of the same level. Three tests of a support zone either build a base or eventually break it.
The 20-day EMA at $0.07192 and Bollinger midline at $0.07180 are the immediate ceiling above, with the 50-day at $0.07679, 100-day at $0.08458, and 200-day at $0.10083 forming a stacked resistance wall above that. A horizontal band near $0.09400 from the June consolidation is the major recovery target if momentum returns. Below the demand zone, the next meaningful support sits near $0.0575.
What Are The Key Support And Resistance Levels For DOGE In August?
Resistance Levels
- $0.07180 — Bollinger midline and 20-day EMA cluster
- $0.07479 — Bollinger upper band
- $0.07679 — 50-day EMA
- $0.08458 — 100-day EMA
- $0.09400 — Horizontal resistance from June consolidation
Support Levels
- $0.06881 — Lower Bollinger Band and demand zone floor
- $0.06700 — Demand zone lower boundary
- $0.05750 — Lower support band, last floor before uncharted 2026 territory
Has August Historically Been Strong For DOGE?
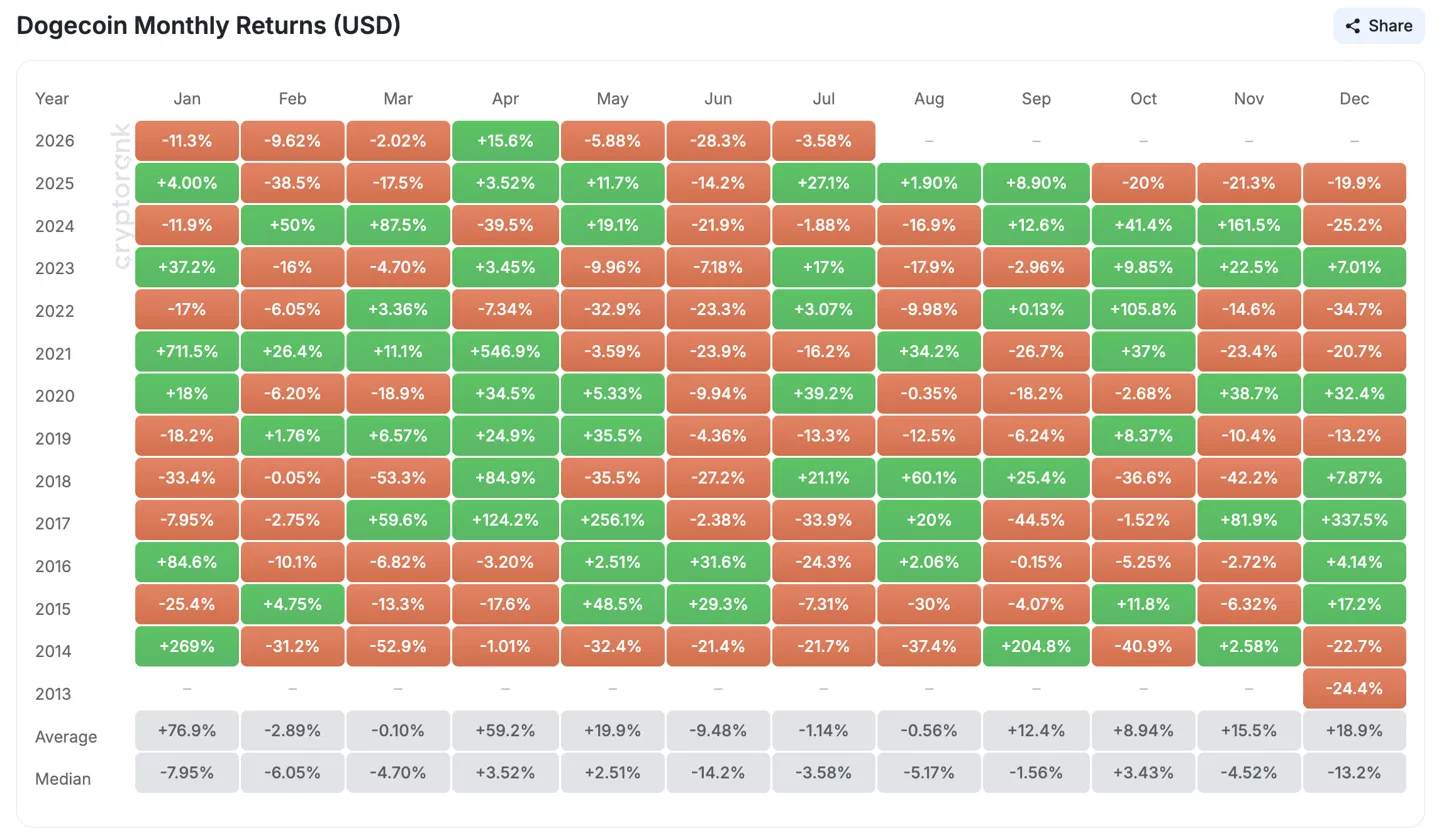
The Dogecoin monthly returns table makes August its second worst seasonal month. The median sits at -5.17% across thirteen years of data with eight red closes. Notable August losses include -37.4% in 2014, -30% in 2015, -17.9% in 2023, -16.9% in 2024, and -12.5% in 2019.
The positive Augusts were +204.8% in 2014 as an outlier, +60.1% in 2018, +34.2% in 2021, +20% in 2017, and +1.90% in 2025. The average of -0.56% is heavily distorted by 2014’s outlier in both directions. The base expectation for August is a mild to moderate negative return without a macro catalyst.
DOGE August 2026 Weekly Forecast
| Period | Price Range | Outlook |
| Aug 1-8 | $0.065 – $0.078 | Demand zone hold or break, CLARITY Act final window |
| Aug 9-20 | $0.062 – $0.082 | Post-recess direction, seasonal weakness historically peaks mid-month |
| Aug 21-31 | $0.060 – $0.085 | September FOMC pricing builds, TD Sequential follow-through or failure |
TD Sequential Buy Signals Fired Across Four Timeframes At Once
Ali Charts flagged on July 27 that DOGE’s TD Sequential printed buy signals simultaneously on the monthly, weekly, 3-day, and daily charts. The TD Sequential is a time-based exhaustion indicator that identifies when a trend has run its natural course. A single timeframe signal is common enough.
Two timeframes aligning is notable. Four timeframes firing at once is the kind of setup Ali Charts described as rare, and it is arriving at the same moment DOGE is retesting its demand zone for the third time.
DOGE Is One Of The Weakest Performers Against Bitcoin Right Now
Analyst Enri.hl noted on July 30 that DOGE is one of the weakest tickers in the market relative to Bitcoin, down 43% from its two-month high near $0.118 while Bitcoin has held comparatively better through the same period.
He described the current price as retesting the bulls demand zone plotted after the breakout of July’s low, with the zone serving as the line between a recovery setup and a continuation lower. Three tests of the same demand zone in a short timeframe either builds a base or eventually breaks it, and the derivatives data gives some indication of which way participants are leaning.
What Derivatives Show About Current Positioning
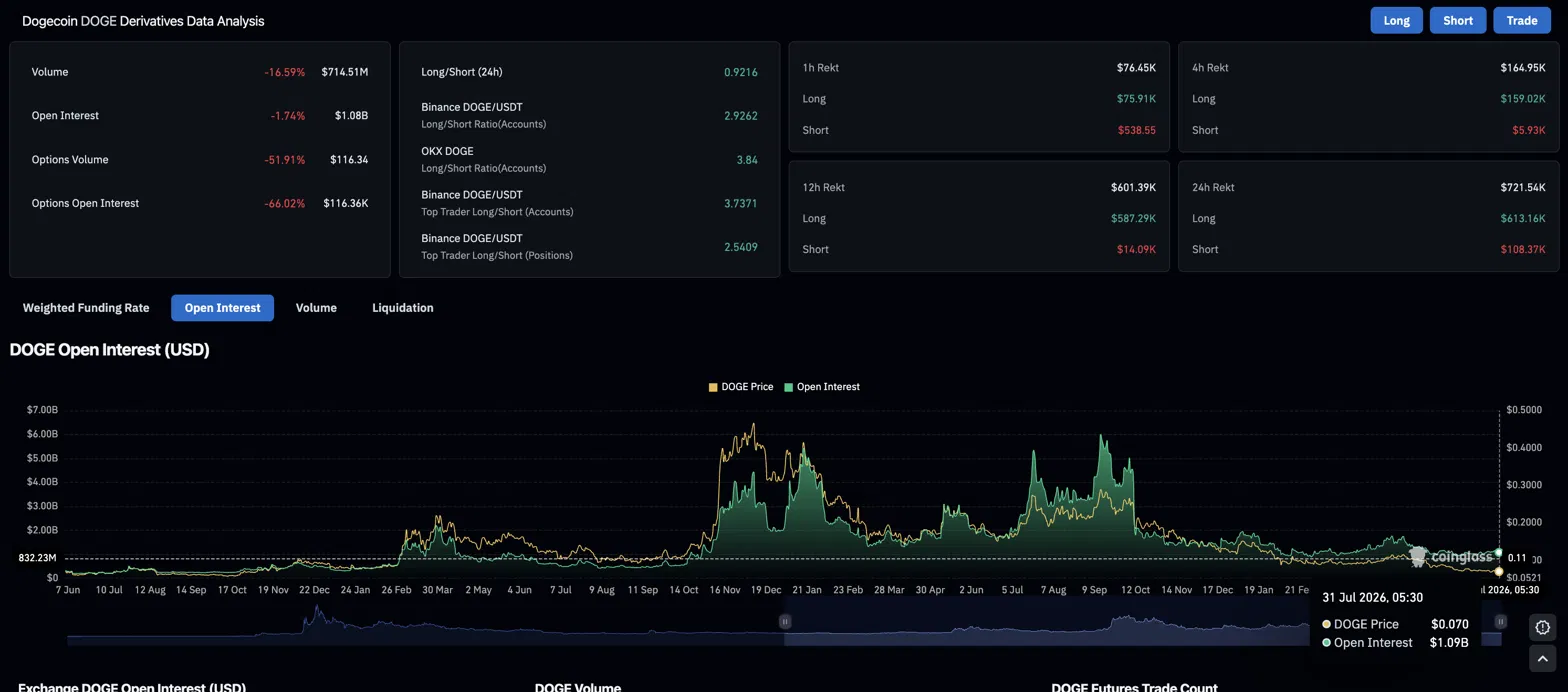
Volume fell 16.59% to $714.51M while open interest slipped 1.74% to $1.08B. Options volume collapsed 51.91% to $116.34 and options open interest fell 66.02% to $116.36K, reflecting a market where traders have stepped back entirely from hedging or speculative positioning.
Long liquidations over 24 hours hit $613.16K against $108.37K for shorts, a 5.7 to 1 ratio showing longs are absorbing the demand zone retest rather than shorts adding pressure. Top traders on Binance hold a 3.74 long/short ratio on accounts and 2.54 on positions, the most net long reading across any major token in this review cycle. Retail sits at 0.9216, nearly balanced.
Dogecoin Price Prediction August 2026: Upside and Downside Targets
- Upside case: The demand zone holds on the third test, TD Sequential buy signals confirm across all four timeframes with a follow-through candle, CLARITY Act passage before August 8 sparks a broader altcoin move, and DOGE reclaims the 20-day EMA at $0.07192 toward the Bollinger upper band at $0.07479 and the 50-day at $0.07679.
- Downside case: The demand zone breaks on the third test, August seasonal weakness follows its -5.17% median, the TD Sequential signals fail to confirm, and DOGE slides toward the lower support band near $0.0575 as DOGE continues underperforming Bitcoin through the month.
Disclaimer: The information presented in this article is for informational and educational purposes only. The article does not constitute financial advice or advice of any kind. Coin Edition is not responsible for any losses incurred as a result of the utilization of content, products, or services mentioned. Readers are advised to exercise caution before taking any action related to the company.




