





- Spot ETH ETFs logged a third consecutive positive week with $18.39M in net inflows, pushing total net assets above $10.52B
- Binance stablecoin netflow fell 518% week-over-week per analyst Aria Naka, the largest structural move across 148 tracked metrics
- August has a -1.87% median return for ETH across eleven years of data, with seven red closes making it a mild but consistent seasonal headwind
Ethereum trades at $1,887.46 on July 31, down 1.5%, pulling back from $1,934 as the descending trendline continues capping recovery attempts and stablecoin liquidity on Binance shows the largest structural reversal in the tracked dataset.
ETH Is Being Rejected At The Descending Trendline And The 100-Day EMA For The Third Time
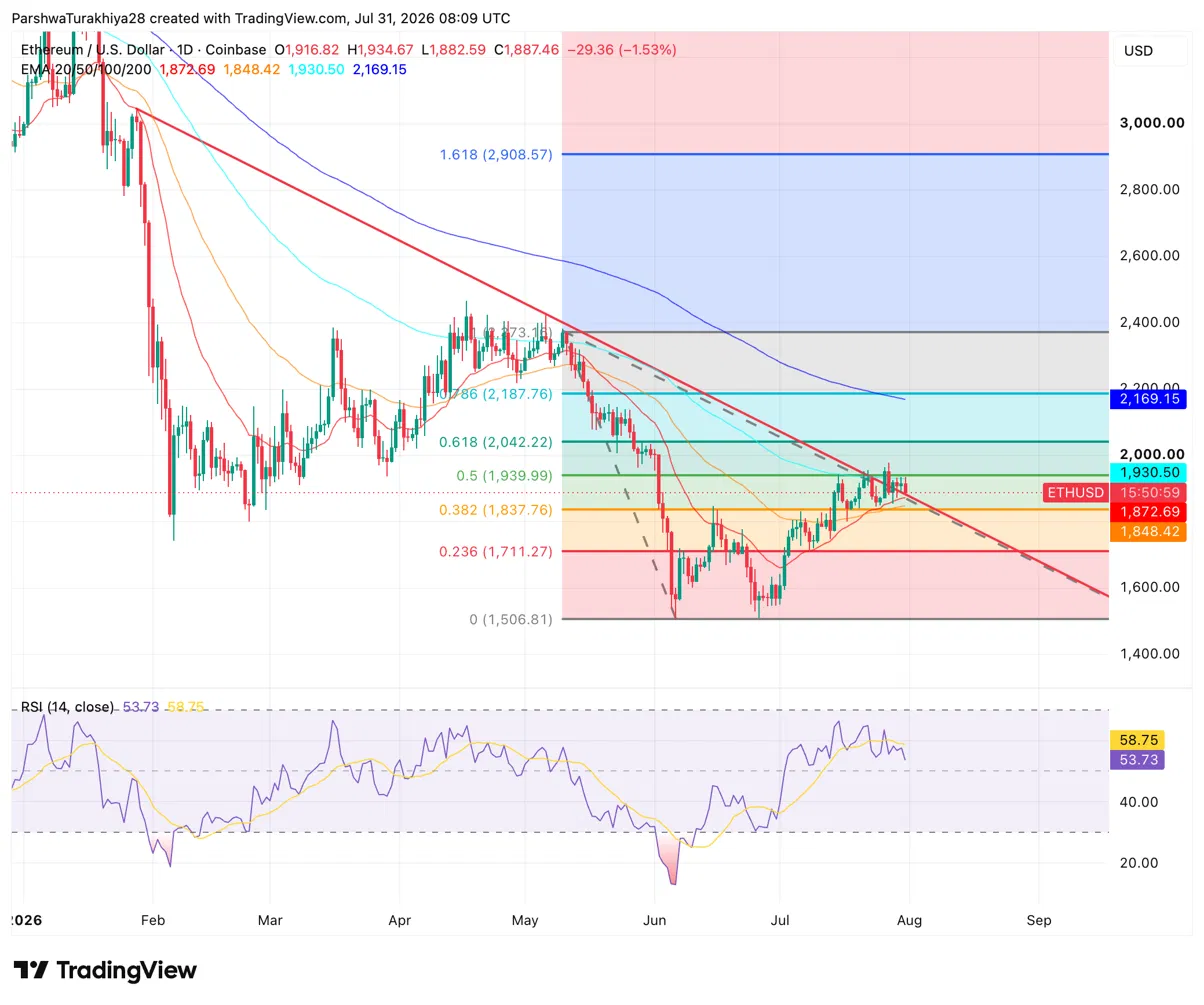
The daily chart shows ETH making a third attempt to close above the descending trendline from May’s peak and the 100-day EMA at $1,930.50, and a third rejection is forming. The RSI at 53.73 sits below its signal line at 58.75, suggesting momentum is fading rather than building into the resistance test. Price has spent two weeks oscillating between $1,840 and $1,953 without a decisive breakout in either direction.
Below current price, the 20-day EMA at $1,872.69 and the 0.382 Fibonacci at $1,837.76 form the immediate support cluster. The 50-day EMA at $1,848.42 sits inside that zone as well, making the $1,837 to $1,872 range the key floor for the recovery structure. A daily close below $1,837 opens the 0.236 Fibonacci at $1,711.27. Above, clearing $1,930 on a daily close would open the 0.5 Fibonacci at $1,939.99 and the 0.618 at $2,042.22.
What Are The Key Support And Resistance Levels For ETH In August?
Resistance
- $1,930.50 — 100-day EMA and descending trendline, three-time rejection zone
- $1,939.99 — 0.5 Fibonacci
- $2,042.22 — 0.618 Fibonacci, next meaningful target on a breakout
- $2,169.15 — 200-day EMA and 0.786 Fibonacci zone
Support
- $1,872.69 — 20-day EMA
- $1,848.42 — 50-day EMA
- $1,837.76 — 0.382 Fibonacci, last floor before structure breaks
- $1,711.27 — 0.236 Fibonacci and deeper support
Has August Historically Been Strong For ETH?
The Ethereum monthly returns table shows August with a -1.87% median across eleven years of data. Seven of those eleven Augusts closed red, including -34.8% in 2018, -22.2% in 2024, -20.9% in 2019, -11.3% in 2023, and -7.51% in 2022.
The positive years were 2015 at +28.3%, 2017 at +87.1%, 2020 at +25.6%, and 2021 at +35.9%, all concentrated in earlier bull market years. The average sits at +8.84% but is entirely distorted by those outlier years. The median is the more honest read, and it points to a modest negative month as the base case.
ETH August 2026 Weekly Forecast
| Period | Price Range | Outlook |
| Aug 1-8 | $1,780 – $1,960 | CLARITY Act final window, hawkish Fed repricing, trendline resistance holds |
| Aug 9-20 | $1,720 – $2,000 | Post-recess direction, September FOMC pricing starts building |
| Aug 21-31 | $1,700 – $2,050 | Seasonal weakness peaks, stablecoin liquidity resolution likely determines direction |
Three Straight Positive ETF Weeks As Morgan Stanley’s MSSE Records First Inflows
Spot Ethereum ETFs logged $13.29M in daily net inflows on July 30, with BlackRock’s ETHA leading at $16.24M. The week of July 30 shows $18.39M in net inflows so far, marking the third consecutive positive week after the category logged $105.44M and $103.90M in the prior two weeks.
Related: XRP Price Prediction August 2026: Can XRP Break the Yearly Downtrend as Grayscale’s CEO Sells GXRP?
Note that one trading session remains in this week’s count. Cumulative net inflows stand at $11.20B with total net assets at $10.52B. Morgan Stanley’s newly launched MSSE recorded its first inflow at $413.43K, the first sign of activity from the new product since its launch.
Stablecoin Liquidity On Binance Just Made Its Biggest Structural Move In The Dataset
Analyst Aria Naka flagged on July 31 that stablecoin inflows to Binance collapsed 518% week-over-week, the largest single move across 148 metrics tracked. Stablecoins flowing into an exchange typically precede spot buying. When they leave instead, it reduces the buying firepower available for ETH on the market’s deepest venue. That is the practical implication of this number.
Three other signals point in the same direction. The Coinbase premium index fell to -0.12, meaning US buyers are paying slightly less for ETH than the global market, a sign of softer domestic demand. Large-holder exchange activity is declining across weekly, monthly, and quarterly windows, suggesting bigger players are stepping back rather than adding exposure. ETH fees burned rose 48% on the week but remain 54% below their 90-day average, meaning the network is busier than it was but far from operating at full capacity.
The one counter-signal is the staking rate, which has risen to 33.90%. More ETH being staked means less available to sell, which limits downside. Naka described the overall picture as a transitional zone that has historically preceded a directional resolution rather than a trend in either direction. The stablecoin shift on Binance is the number worth watching to see which way that resolution breaks.
Ethereum Price Prediction August 2026: Upside and Downside Targets
- Upside case: ETH closes above the 100-day EMA at $1,930.50 and the descending trendline on a daily basis, stablecoin liquidity returns to Binance after the current repositioning resolves, ETF weekly inflows extend to a fourth consecutive positive week, and price targets the 0.5 Fibonacci at $1,939.99 and 0.618 at $2,042.22 as the CLARITY Act catalyst arrives before August 8.
- Downside case: The trendline rejection holds for a third time, ETH loses the 20-day EMA at $1,872.69 and the 0.382 Fibonacci at $1,837.76, stablecoin liquidity on Binance does not recover, and August seasonal weakness pushes price toward the 0.236 Fibonacci at $1,711.27 as September rate hike probability keeps institutional positioning defensive.
Disclaimer: The information presented in this article is for informational and educational purposes only. The article does not constitute financial advice or advice of any kind. Coin Edition is not responsible for any losses incurred as a result of the utilization of content, products, or services mentioned. Readers are advised to exercise caution before taking any action related to the company.




