


- Technical indicators suggest that DOT’s price has recorded its bottom.
- DOT’s price recently broke out of a bullish chart pattern that had formed on its daily chart over the past few weeks.
- Meanwhile, AVAX will need to overcome an overwhelming medium-term negative trend line on its charts.
As the cryptocurrency community prepares for the next bull cycle, traders and investors scour the market for great opportunities to purchase their favorite cryptocurrencies at a discount. Two projects that show a substantial amount of potential are Polkadot (DOT) and Avalanche (AVAX) as investors seek the next Layer-1 project that could potentially surpass Ethereum.
From a technical perspective, DOT’s bottom for this bear market may have been established given the fact that the altcoin recently broke out of a bullish chart pattern. AVAX, however, may still be at risk of its price dropping further in the coming 2 weeks as a negative trend line formed on its charts.
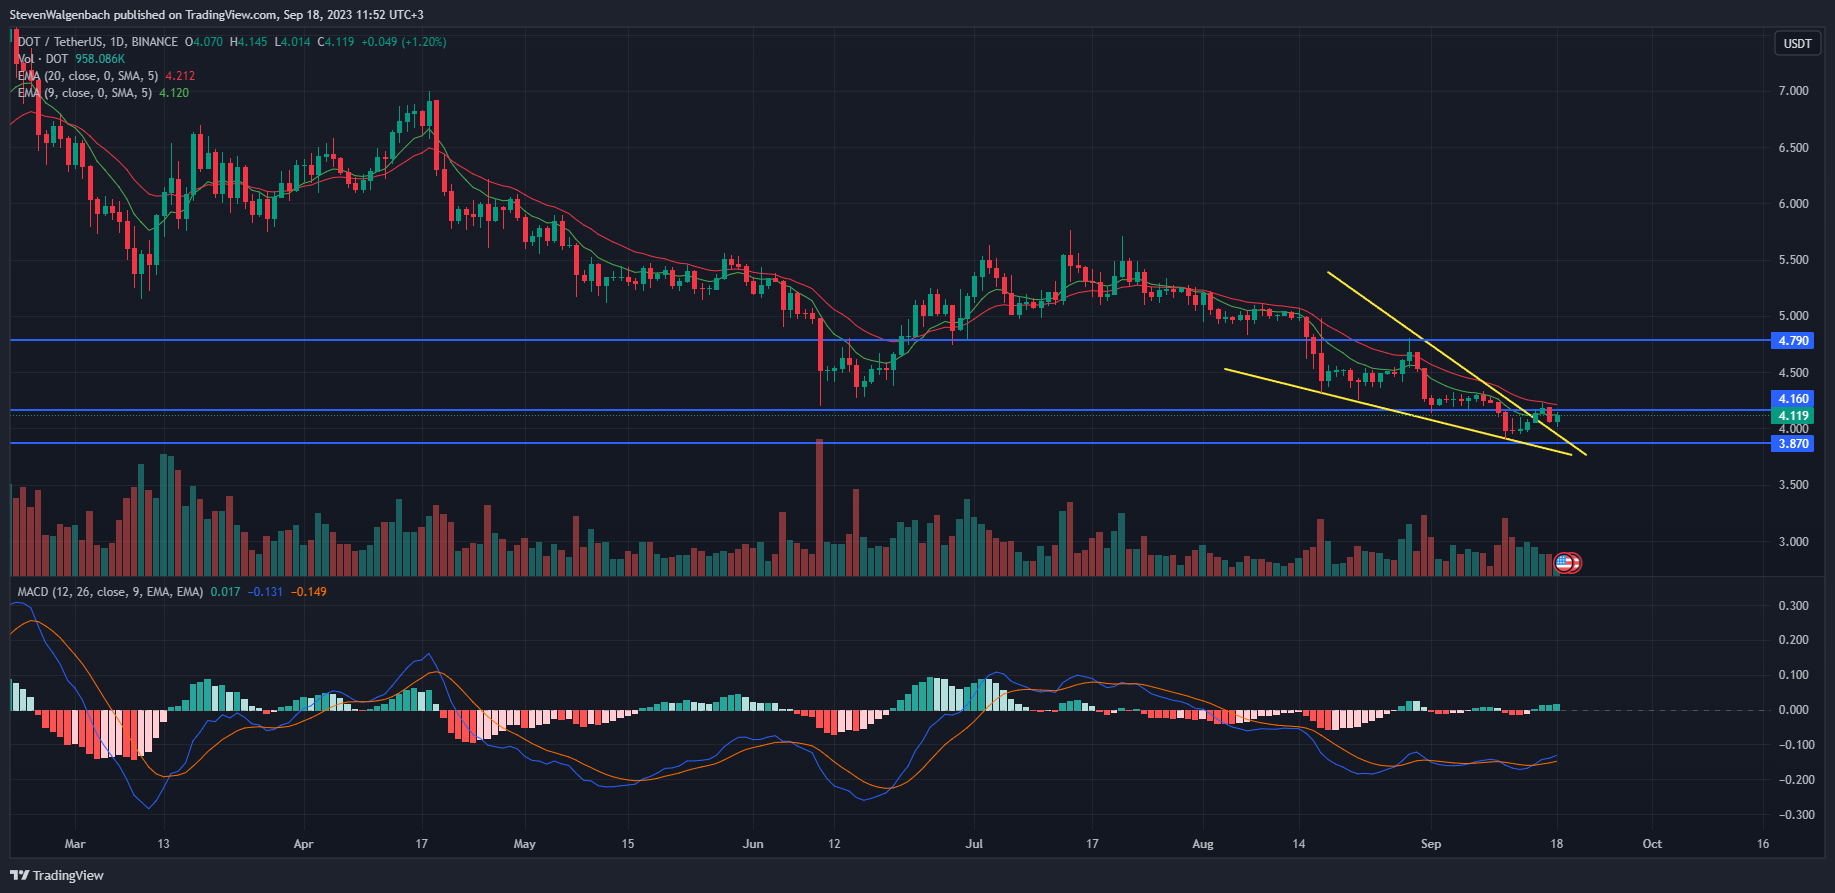
DOT’s price broke out of a bullish falling wedge pattern over the past 4 days and continued to trade above this chart pattern at press time. However, the altcoin’s price will need to break above the $0.4160 resistance level and flip it into support before traders can confidently enter into a long position for DOT.
If DOT is able to close a daily candle above this resistance level, then the bullish chart pattern may be validated, resulting in the cryptocurrency’s value climbing to $4.790 in the following week. On the other hand, DOT’s price failing to close a daily trading session above $4.160 within the coming 48 hours may invalidate this bullish thesis.
In this scenario, DOT’s price may correct back to within the bullish chart pattern to the immediate support at $3.870. Traders and investors will want to take note of the fact that technical indicators favored a bullish outlook at press time.
Most notably, a bullish technical flag was triggered by the Moving Average Convergence Divergence (MACD) indicator on DOT’s daily chart. Over the past 4 days, the MACD line crossed bullishly above the MACD Signal line. This suggested that DOT’s price was undergoing a bullish trend reversal.
If this technical flag is validated, then DOT’s price may flip the aforementioned $4.160 mark into support, which was also confluent with the 9-day EMA line. Thereafter, traders may want to keep an eye on the 9-day and 20-day EMA lines, as they may cross in the following week. Should this happen, it will signal that buyers have gained the upper hand.
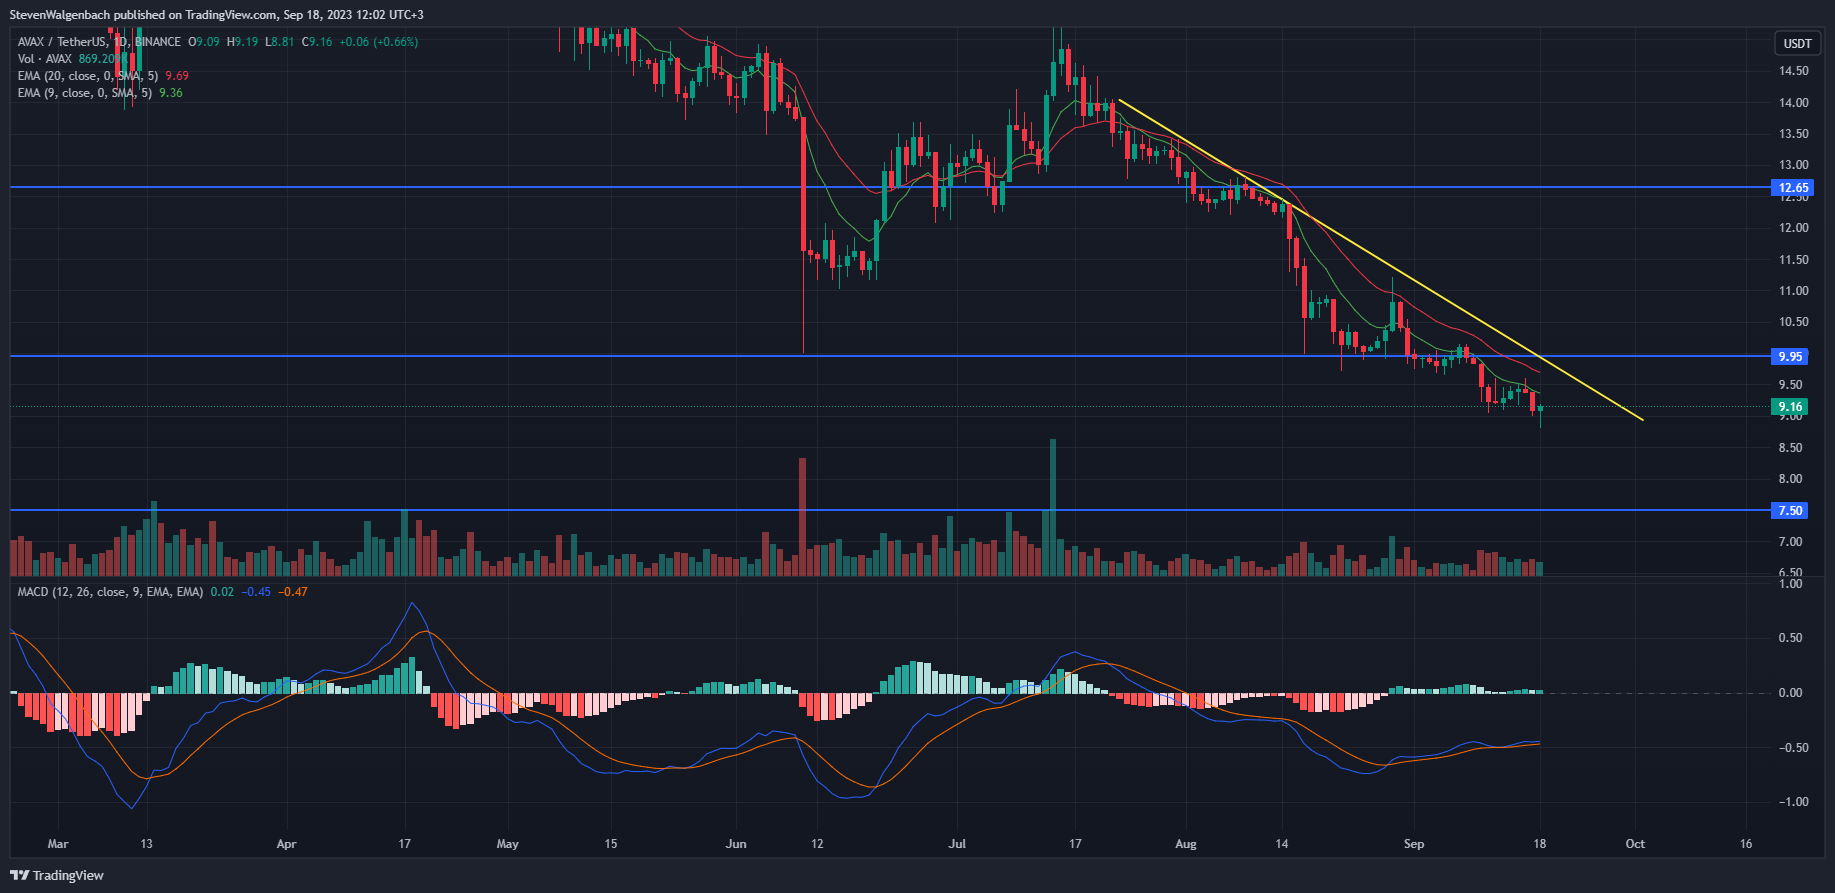
Meanwhile, AVAX’s price may continue to drop in the next few days given the medium-term descending trendline that had formed on its daily chart over the past few weeks. If this bearishness continues, the altcoin’s price may drop to the next support level at $7.50 before the end of this month.
On the other hand, if AVAX is able to break above the negative trend line to above the $9.95 threshold, then the bearish thesis will be invalidated. If AVAX is able to close a daily candle above this significant price point, then it may continue to rise to the next major resistance at $12.65 through the course of the following fortnight.
Technical indicators suggested, however, that AVAX’s bottom may not be in yet. Firstly, the 9-day EMA line was positioned below the 20-day EMA line. This suggested that short-term momentum was in favor of sellers, which may result in AVAX’s price dropping in the upcoming couple of days.
In addition to this, the daily MACD line had a negligible gap between itself and the MACD Signal line. Therefore, a small price movement down may result in the two lines crossing. This will confirm a continuation of AVAX’s negative trend and lead to a further drop in AVAX’s price.
From a short-term term perspective, both AVAX and DOT printed 24-hour losses according to CoinMarketcap. At press time, AVAX was changing hands at $9.15 after its price slipped 1.25%. Meanwhile, DOT’s 0.26% drop in price meant that its price stood at $4.13.
Disclaimer: The views and opinions, as well as all the information shared in this price analysis, are published in good faith. Readers must do their own research and due diligence. Any action taken by the reader is strictly at their own risk. Coin Edition and its affiliates will not be held liable for any direct or indirect damage or loss.
Disclaimer: The information presented in this article is for informational and educational purposes only. The article does not constitute financial advice or advice of any kind. Coin Edition is not responsible for any losses incurred as a result of the utilization of content, products, or services mentioned. Readers are advised to exercise caution before taking any action related to the company.


