


- DOT was able to overtake both MATIC and LINK to become the twelfth-largest cryptocurrency by market cap.
- DOT was changing hands at $6.86 after its price underwent a correction in the past 24 hours.
- Technicals suggest that DOT’s bullish momentum may have reached a peak.
Polkadot (DOT) was able to climb above Chainlink (LINK) and Polygon (MATIC) in terms of market cap. This is after DOT’s price surged more than 21.50% over the past week.
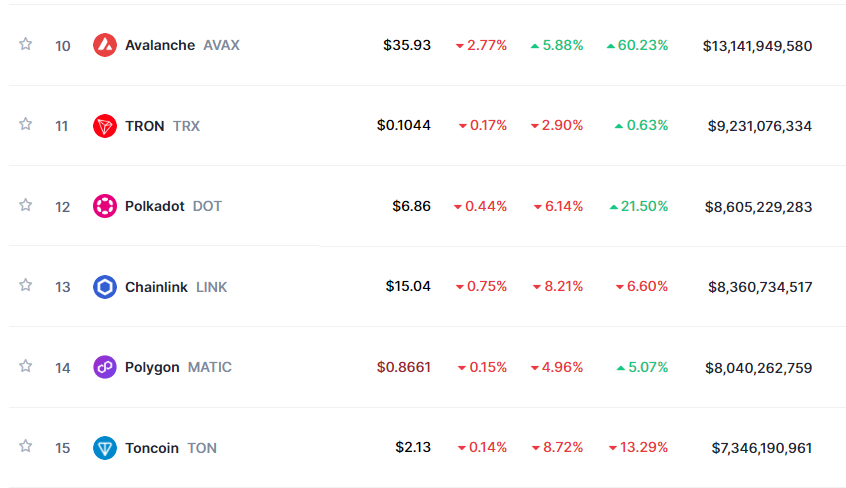
At press time, DOT was trading hands at $6.86 according to CoinMarketCap data. Despite the altcoin’s price undergoing a slight correction in the past 24 hours, DOT was still ranked above LINK and MATIC in terms of market cap.
DOT outperformed LINK throughout the past day of trading as well, as LINK saw its price drop more than 8%. MATIC was the best performer of the three cryptocurrencies, as it only recorded a 24-hour loss of 4.96% during the same period. Subsequently, LINK changed hands at $15.04, while MATIC’s price stood at $0.8661.
In terms of market cap, DOT had a total valuation of $8.605 billion. On its heels was LINK with its cap of $8.377 billion. Both of these cryptocurrencies stated above had a slight advantage over MATIC, which had a total market cap of just over $8 billion.
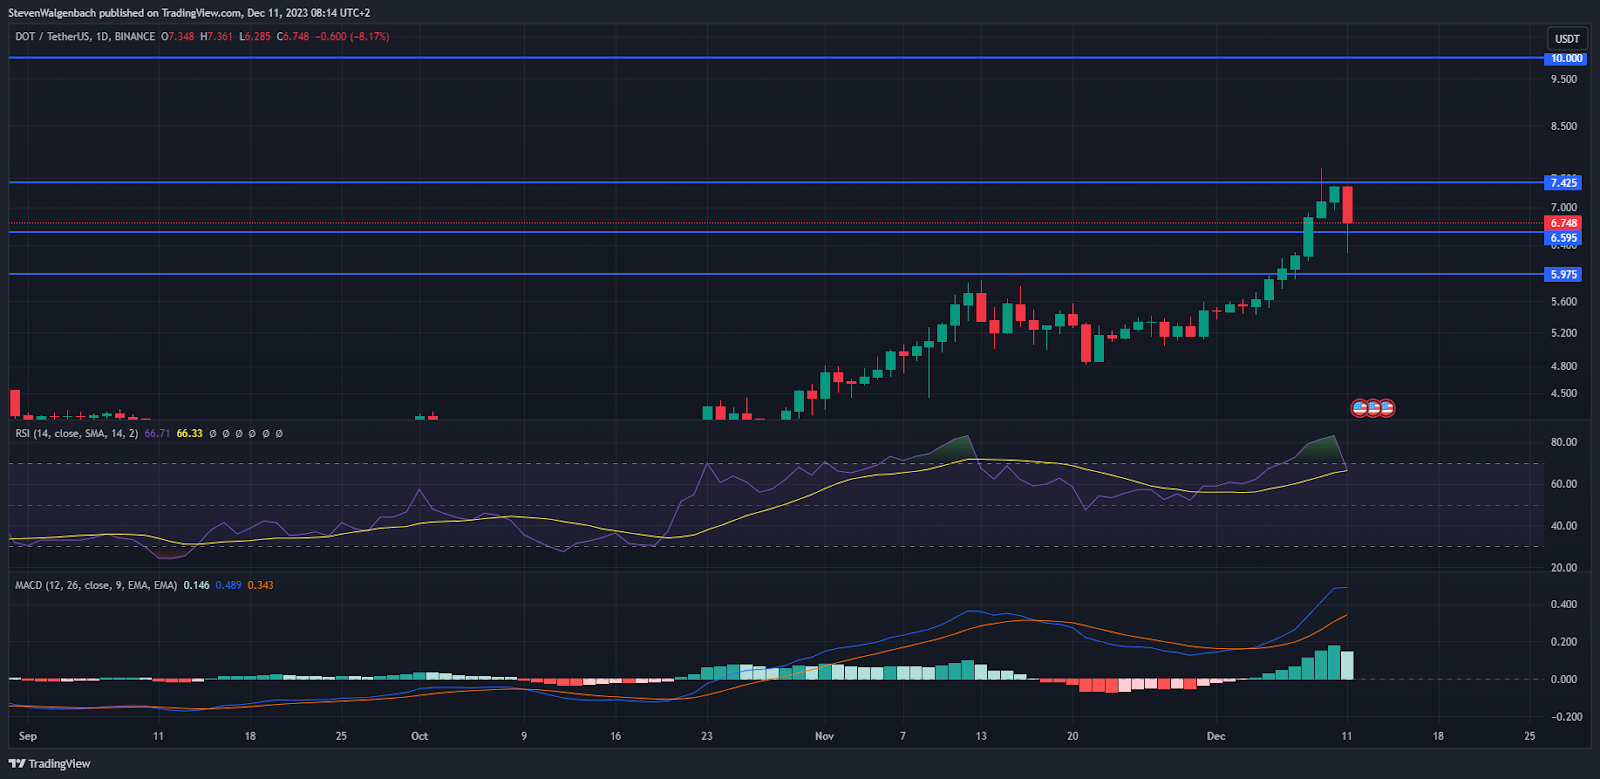
From a technical standpoint, DOT was rejected by the $7.425 resistance level over the past 24 hours. This rejection caused it to correct to below the $6.595 support level earlier in today’s trading session. Since then, bulls have been able to boost the altcoin’s price to back above $6.595.
Should DOT close today’s trading session above this significant price point, then it may attempt another challenge at the $7.425 resistance level in the next 24 – 48 hours. A break above this barrier will then clear a path for the cryptocurrency’s value to climb to as high as $10 in the following couple of days.
On the other hand, a daily close below $7.425 today may invalidate the bullish thesis. In this more bearish scenario, DOT may retest the aforementioned $6.595 support level. Thereafter, DOT falling below this mark could expose it to the risk of dropping to $5.975 in the short term.
Technical indicators on the cryptocurrency’s daily chart suggested that it may continue to drop in the coming 24 hours. Both the Moving Average Convergence Divergence (MACD) and the Relative Strength Index (RSI) indicators suggested that buyers were exiting DOT’s charts.
The RSI line was looking to cross below the RSI Simple Moving Average (SMA) at press time. Should these two technical indicators cross, it could signal a bearish shift in momentum. Meanwhile, the slope of the MACD line was leveling off, which may indicate DOT’s bullish momentum has reached a peak.
Disclaimer: The information presented in this article is for informational and educational purposes only. The article does not constitute financial advice or advice of any kind. Coin Edition is not responsible for any losses incurred as a result of the utilization of content, products, or services mentioned. Readers are advised to exercise caution before taking any action related to the company.


