


- DOT market experiences bearish correction after hitting a 30-day high.
- Golden cross movement indicates a possible bullish trend reversal for the DOT market.
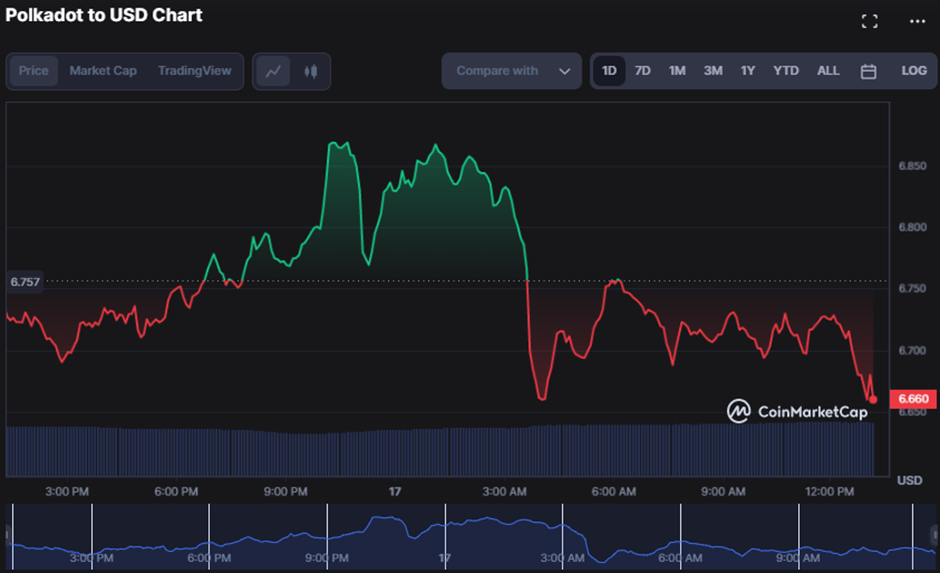
- As of press time, the bears still have control over the DOT market, causing a 1.07% dip to $6.67.
The Polkadot (DOT) market had a bearish start to the week, but the bulls quickly gained control and drove the price to a 30-day high of $6.8705. However, the bullish trend didn’t last long, as the market soon experienced a bearish correction. This caused DOT’s price to drop to an intra-day low of $6.65, where support was established.
As of press time, the bears still have control over the DOT market, causing a 1.07% dip to $6.67. If the bearish momentum persists and the $6.65 support is broken, the next support level may be $6.50. This could trigger further selling pressure and lead to a deeper correction in the DOT market.
On the other hand, if the bulls recover the losses and push the price above the resistance level of $6.87, we may see a bullish trend forming. The next resistance level would be $7.00, indicating a potential upward movement in the DOT market. The market capitalization fell 0.92% to $7,841,906,496 during the correction, but 24-hour trading rose 9.09% to $205,196,667, indicating that investors are actively buying and selling in response to market fluctuations.
The Keltner Channel Bands are shrinking on the DOT/USD price chart, with the top band at 6.92, the middle band at 6.71, and the bottom band at 6.49. This motion implies a time of low volatility. The existence of red candlesticks below the middle bar, on the other hand, indicates that the bears are in charge and may drive the price toward the bottom band.
The Klinger Oscillator, which has gone below its signal line with a value of -3.744k, adds to the pessimistic attitude. This shift indicates that purchasing pressure is weakening while selling pressure is increasing, which supports the downward trend.
The movement of the 20-day moving average (6.75) above the 100-day moving average (6.41) shows that the negative momentum in the DOT market is fading and that a probable trend reversal to bullishness is on the horizon.
This “golden cross” movement is a bullish indication for traders and investors, suggesting that the price of DOT may climb further and that the present bear reign may be a “buying opportunity” for those wishing to join the market.
The Relative Strength Index (RSI) is trending below its signal line (59.29) with a value of 51.95, indicating that the price of DOT may face some short-term swings before resuming its upward trajectory. However, if the RSI drops below the oversold level of 30, it may signal a buying opportunity for investors.
As DOT’s price faces short-term swings, the golden cross movement and active trading suggest a potential trend reversal to bullishness for investors.
Disclaimer: The views, opinions, and information shared in this price prediction are published in good faith. Readers must do their research and due diligence. Any action taken by the reader is strictly at their own risk. Coin Edition and its affiliates will not be liable for direct or indirect damage or loss.
Disclaimer: The information presented in this article is for informational and educational purposes only. The article does not constitute financial advice or advice of any kind. Coin Edition is not responsible for any losses incurred as a result of the utilization of content, products, or services mentioned. Readers are advised to exercise caution before taking any action related to the company.


