


 Eyes an Intraday Rise of Over 13%")
- $ENA value has doubled since its debut, surging 13.54% in 24 hours.
- Large $ENA transfer to Binance hints at bullish momentum.
- Technical indicators suggest $ENA may face short-term pullback.
In a financial development, the digital currency $ENA witnessed an unprecedented surge, doubling its value since its market debut. This growth story unfolded as Lookonchain, a renowned analytics platform, reported a notable transaction involving the $ENA currency.
According to Lookonchain, just six hours ago, a wallet transferred 62.5 million $ENA, valued at approximately $83.75 million, to the global cryptocurrency exchange Binance. The origins of this substantial amount of $ENA trace back to the Gnosis Safe Proxy wallet associated with the Ethena team, from where the wallet received the funds four days prior.
ENA Token Surges 13.54% in a Day, Hits $1.404 Peak
Following the news, the price of the Ethena (ENA) token has experienced a notable rise, marking a 13.54% increase over the past 24 hours. Data sourced from CoinStats highlights that within today’s trading session, ENA’s price fluctuated between $1.404, its peak, and $1.089, its lowest point, establishing these figures as the day’s support and resistance levels, respectively.
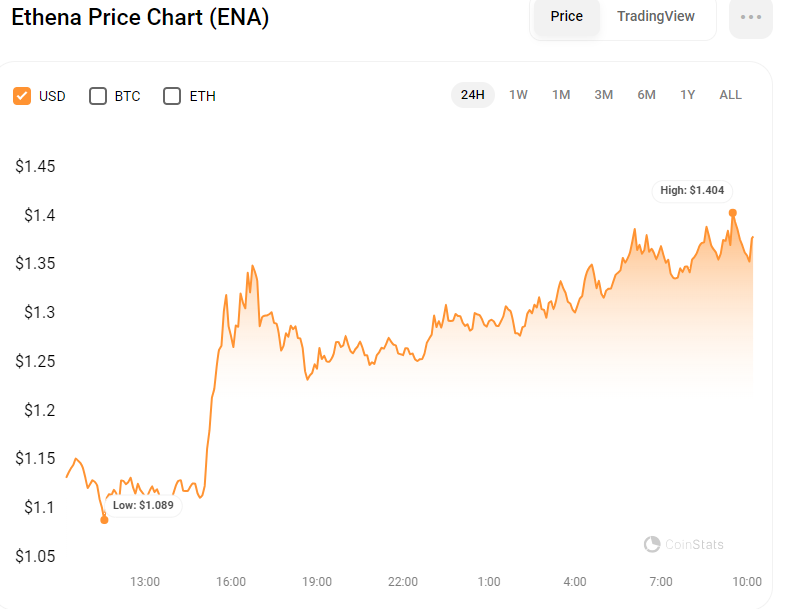
If the bullish momentum behind ENA continues, the target for the bulls is set at $1.404. Should this level be surpassed, ENA’s price could climb higher, setting new intraday highs. Conversely, if this price level proves to be a strong resistance point and prevents an upward breakout, ENA’s price might follow a downward trajectory, potentially revisiting its intraday low.
ENA/USD Technical Analysis
The ENA/USD pair presents a bullish trend on the 1-hour chart, though it is currently facing a corrective phase. The resistance level at $1.404 has emerged as a key hurdle for the token’s upward momentum. Consequently, market analysts view this adjustment as a potential retreat to the $1.22 support level, which is presently the immediate support. Should the price breach the 50% Fibonacci retracement level during this correction, it might indicate a trend reversal, potentially challenging the day’s lowest price.
On the other hand, the $1.22 support level has previously demonstrated resilience and may act as a recovery point if buyers intervene to maintain this price. Stability at this level would suggest that the bullish trend remains active, potentially setting the stage for a retest of the $1.404 resistance to overcome it.
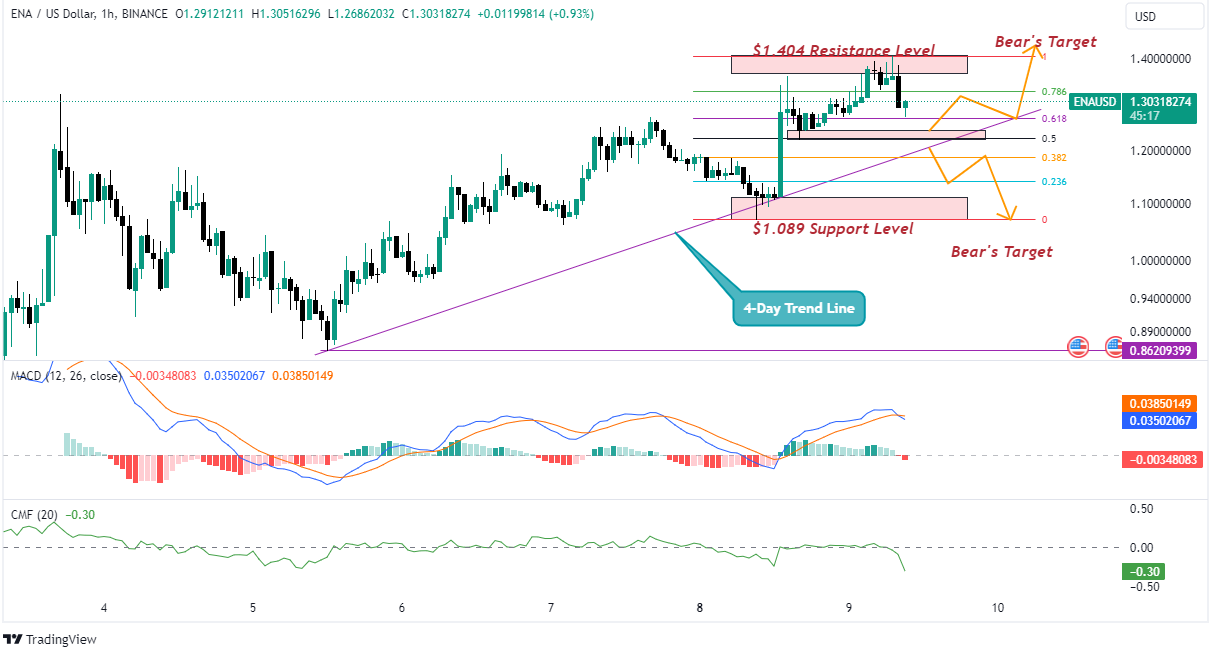
Technical indicators provide further insights into the token’s market dynamics. The Moving Average Convergence Divergence (MACD) indicator, with the MACD line at 0.035, is currently indicating a downward crossover with the signal line. This pattern is typically interpreted as a bearish signal, implying continued selling pressure that could lead to lower price levels.
This outlook is supported by the histogram bars positioned in the red zone, which denote a decline in positive momentum. Additionally, the Chaikin Money Flow (CMF) indicator stands at 0.30 in the negative zone, highlighting a strong money outflow from the token. This aligns with the bearish scenario suggested by the MACD, indicating a potential decrease in the token’s price.
Disclaimer: The information presented in this article is for informational and educational purposes only. The article does not constitute financial advice or advice of any kind. Coin Edition is not responsible for any losses incurred as a result of the utilization of content, products, or services mentioned. Readers are advised to exercise caution before taking any action related to the company.

 Price Prediction 2026, 2027, 2028, 2029, 2030 -2050")


