


- Price rise for Ethereum Classic (ETC) has remained constant, according to recent price analysis.
- The $17.83 resistance level must be held by bulls if the current uptrend is to continue.
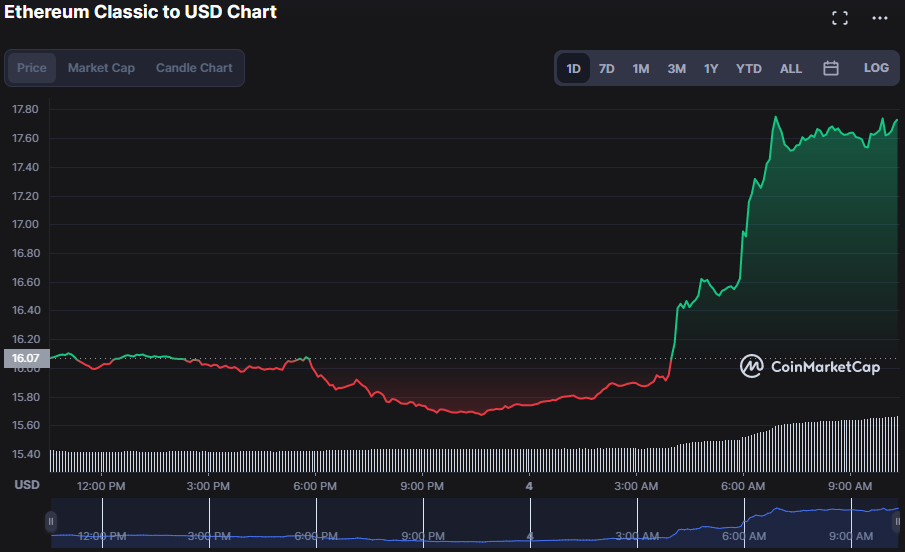
- In the upswing, bulls were successful in pushing prices higher by 10.85%, to $17.80.
Despite starting the day on a strong note, bears dominated trade in Ethereum Classic (ETC) for over half the day. In the last twenty-four hours, the price of Ethereum Classic (ETC) fell to as low as $15.67 due to the persistence of bears. However, bulls bucked this trend and took control of the market, driving the price of ETC up to $17.80, a 10.85% surge, as of press time.
Increased enthusiasm in the ETC market is illustrated by a 10.55% increase in market capitalization to $2,466,475,554 and a 169.15% increase in 24-hour trading volume to $216,942,639.
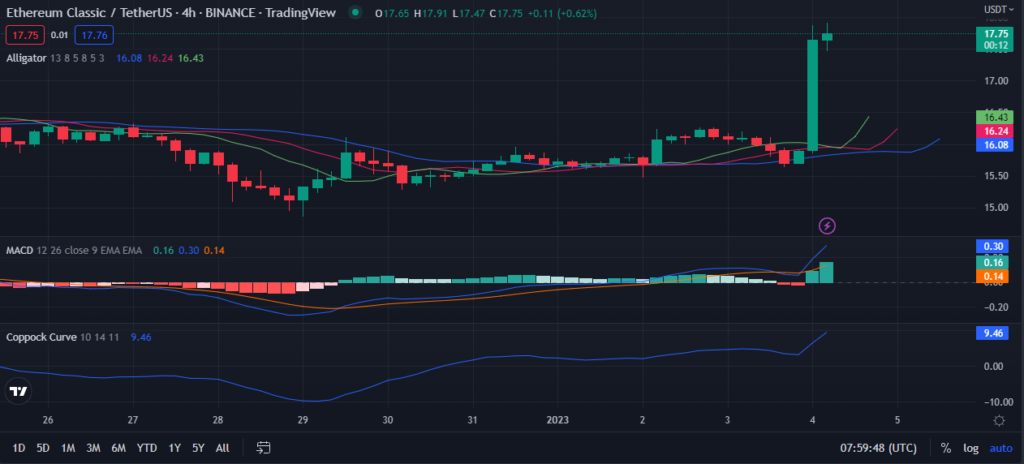
According to the Williams alligator, the three lines are traveling upstream with open mouths, indicating a healthy trend. The intersections of the green (lips), red (teeth), and blue (jaw) lines are all at 16.43, 16.24, and 16.08, respectively. A continuation of this bull run is more likely if prices continue to rise above the alligator’s jaws.
As the blue MACD line surges to a value of 0.030 in the positive territory above its signal line, a bullish crossing has occurred. The rising trend of this MACD line and its migration away from the negative zone foretells further bullish dominance in the ETC market. As the histogram continues to go higher and higher in positive territory, this bullish forecast becomes more credible.
The Coppock curve value of 9.46, which is pointing upwards, also indicates that bulls still have the upper hand on the ETC market. This upward trajectory adds further weight to the notion that the present trend will maintain its momentum.
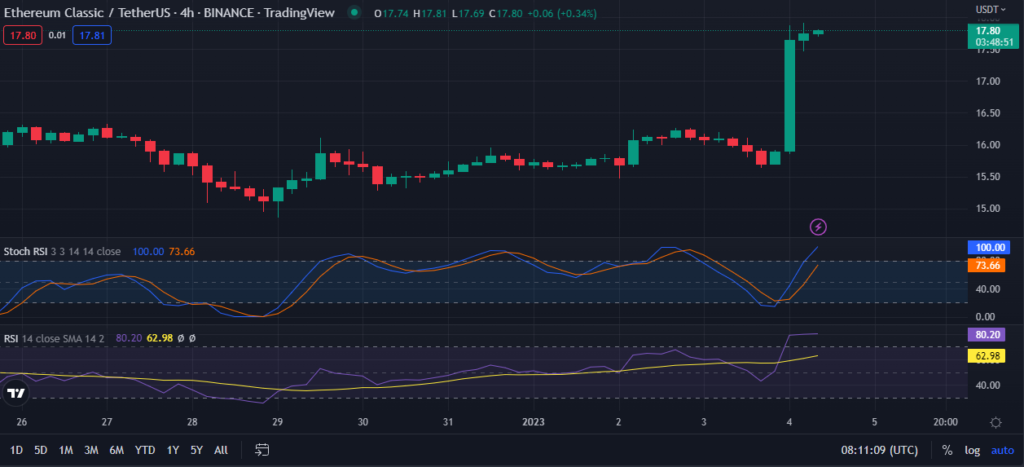
The stochastic RSI for the ETC market is now at 99.47, which is consistent with a continuing positive trend. As the RSI is in the overbought zone, the current upward trend in the ETC market is flagged as potentially vulnerable to reversal.
This optimism is put to the test even more by the fact that the Relative Strength Index (RSI) is heading into the oversold zone with a reading of 79.91. When the RSI reaches its maximum value, it warns traders that the current market trend is at its peak and might reverse.
The bullish trend on the ETC market is expected to continue as long as the buyers can keep the resistance level in place.
Disclaimer: The views and opinions, as well as all the information shared in this price analysis, are published in good faith. Readers must do their own research and due diligence. Any action taken by the reader is strictly at their own risk. Coin Edition and its affiliates will not be held liable for any direct or indirect damage or loss.
Disclaimer: The information presented in this article is for informational and educational purposes only. The article does not constitute financial advice or advice of any kind. Coin Edition is not responsible for any losses incurred as a result of the utilization of content, products, or services mentioned. Readers are advised to exercise caution before taking any action related to the company.


