


- ETH bulls reverse the bearish trend and surge to a new weekly high.
- Golden cross formation suggests buying opportunities for investors.
- Overbought conditions suggest a potential correction soon.
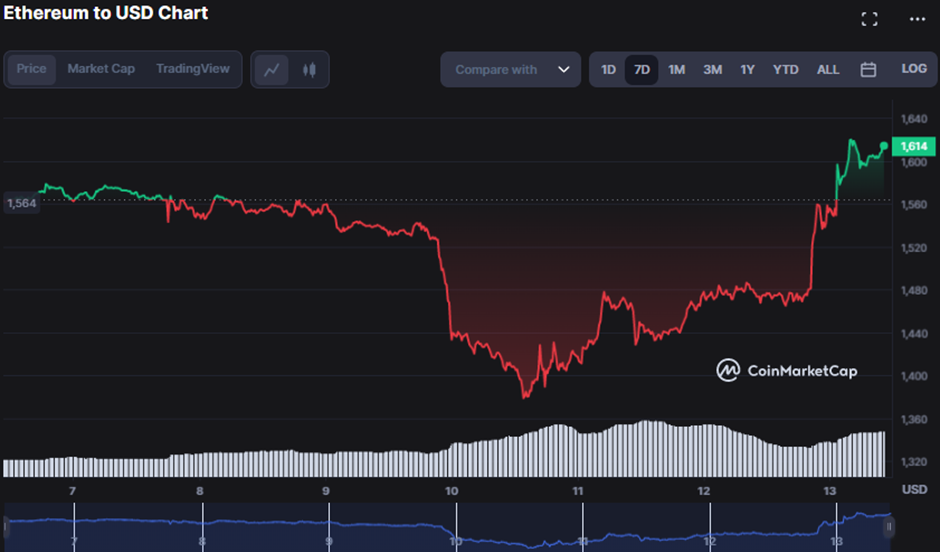
After a week of being under the bear influence, Ethereum (ETH) bulls reversed the downward trend at the start of a new week. After opening the day at $1,461.61, ETH has surged to a new weekly high of $1,629.37 in the last 24 hours, demonstrating this bullish awakening. As of press time, bullish dominance prevailed, causing the ETH price to rise by 10.24% from its daily low of $1,616.40.
Traders hoping to profit from the uptrend joined the rally, increasing market capitalization by 10.20% to $197,930,549,830.
This increase in ETH price and market capitalization is a good sign for the crypto market, indicating that investors are bullish. The 24-hour trading volume increased by 24.22% to $13,224,107,963, indicating increased activity and interest in ETH trading, which could lead to further price increases and market growth soon.
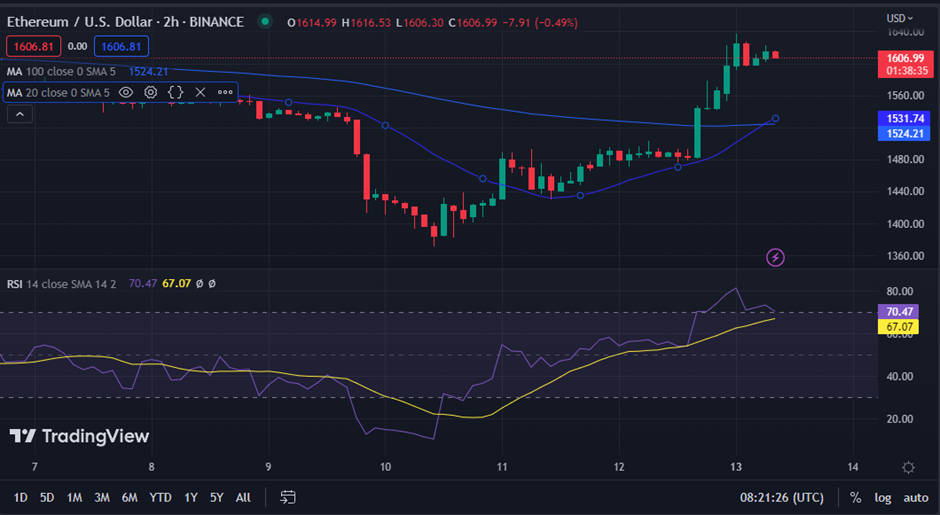
The 20-day moving average just crossed the 100-day moving average, forming a “golden cross” on the 2-hour price chart that may attract additional buyers and push up ETH’s price soon.
This bullish crossing is shown by the 20-day MA touching 1531.83 and the 100-day MA touching 1524.23. This golden cross indicates a prospective market rise and may indicate a buying opportunity for investors.
With an RSI of 72.17, the bullish trend in ETH is considered overbought “and may suggest a probable correction in the near future. Nevertheless, an overbought situation does not always represent a sell signal, as it might also indicate a strong momentum and ongoing upward trend in the price of ETH.
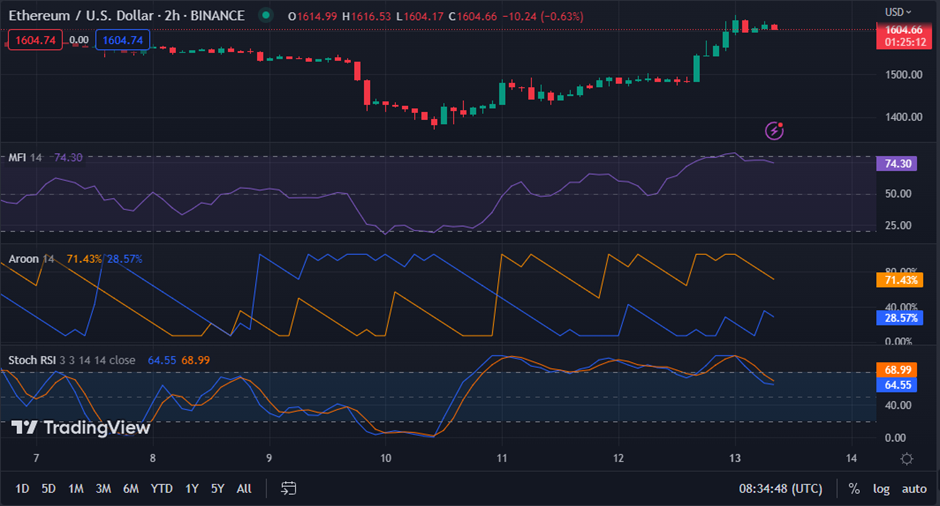
The Money Flow Index (MFI) reading of 74.62 on the ETH price chart indicates that bullish momentum is still strong, and purchasing pressure is building, suggesting a likely continuation of the uptrend soon.
Moreover, the Aroon up is 71.43, while the Aroon down is 28.57%, indicating that the uptrend will continue as the positive trend remains strong. This idea supports the MFI trend, and traders may consider establishing long positions in the market to capitalize on the current upswing.
Nevertheless, the stochastic RSI reading of 65.64 and movement below its signal line imply that the market is overbought and ready for a correction. This motion cautions traders to consider placing stop-loss orders to reduce risk in a quick downturn.
ETH bulls reclaim dominance as price surges and golden cross forms, but caution advised as overbought indicators suggest potential correction ahead.
Disclaimer: The views, opinions, and information shared in this price prediction are published in good faith. Readers must do their research and due diligence. Any action taken by the reader is strictly at their own risk. Coin Edition and its affiliates will not be liable for direct or indirect damage or loss.
Disclaimer: The information presented in this article is for informational and educational purposes only. The article does not constitute financial advice or advice of any kind. Coin Edition is not responsible for any losses incurred as a result of the utilization of content, products, or services mentioned. Readers are advised to exercise caution before taking any action related to the company.


