


- Analyst predicts ETH to hit higher highs, after the formation of the bull flag.
- Ethereum is closing in on the median line of the linear regression channel, it may rise into the first half of the channel.
- Traders may need to take precautions as ETH may be going through a correction or may seek support at the lower trend line.
Crypto Analyst and Trader Bluntz tweeted that he was hoping to see Ethereum reach new highs. He made this prediction after witnessing Ethereum sweep its previous low, followed by a bull flag.
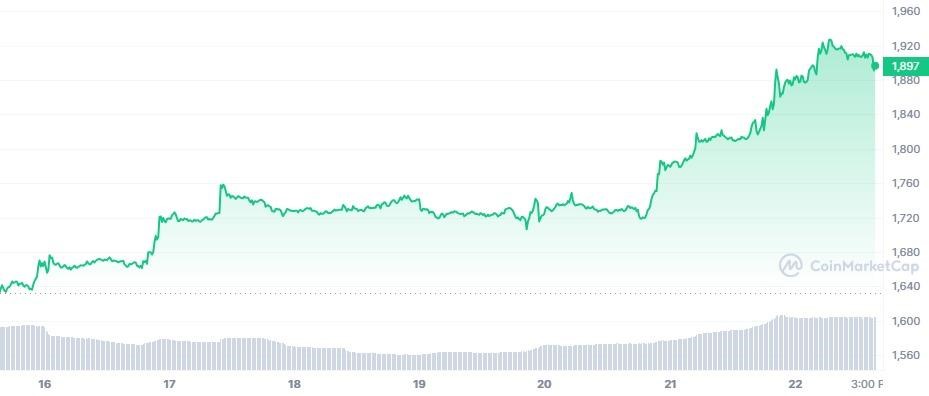
When taking a look at the above chart, Bluntz’s optimistic view could be justified. Ethereum has been triumphant during the past week. In particular, it opened the market at $1,633 on June 16 but abruptly rose to $1,758 by June 17. However, from June 17 to June 20, Ethereum consolidated between the $1,720-$1,760 range before rising again.
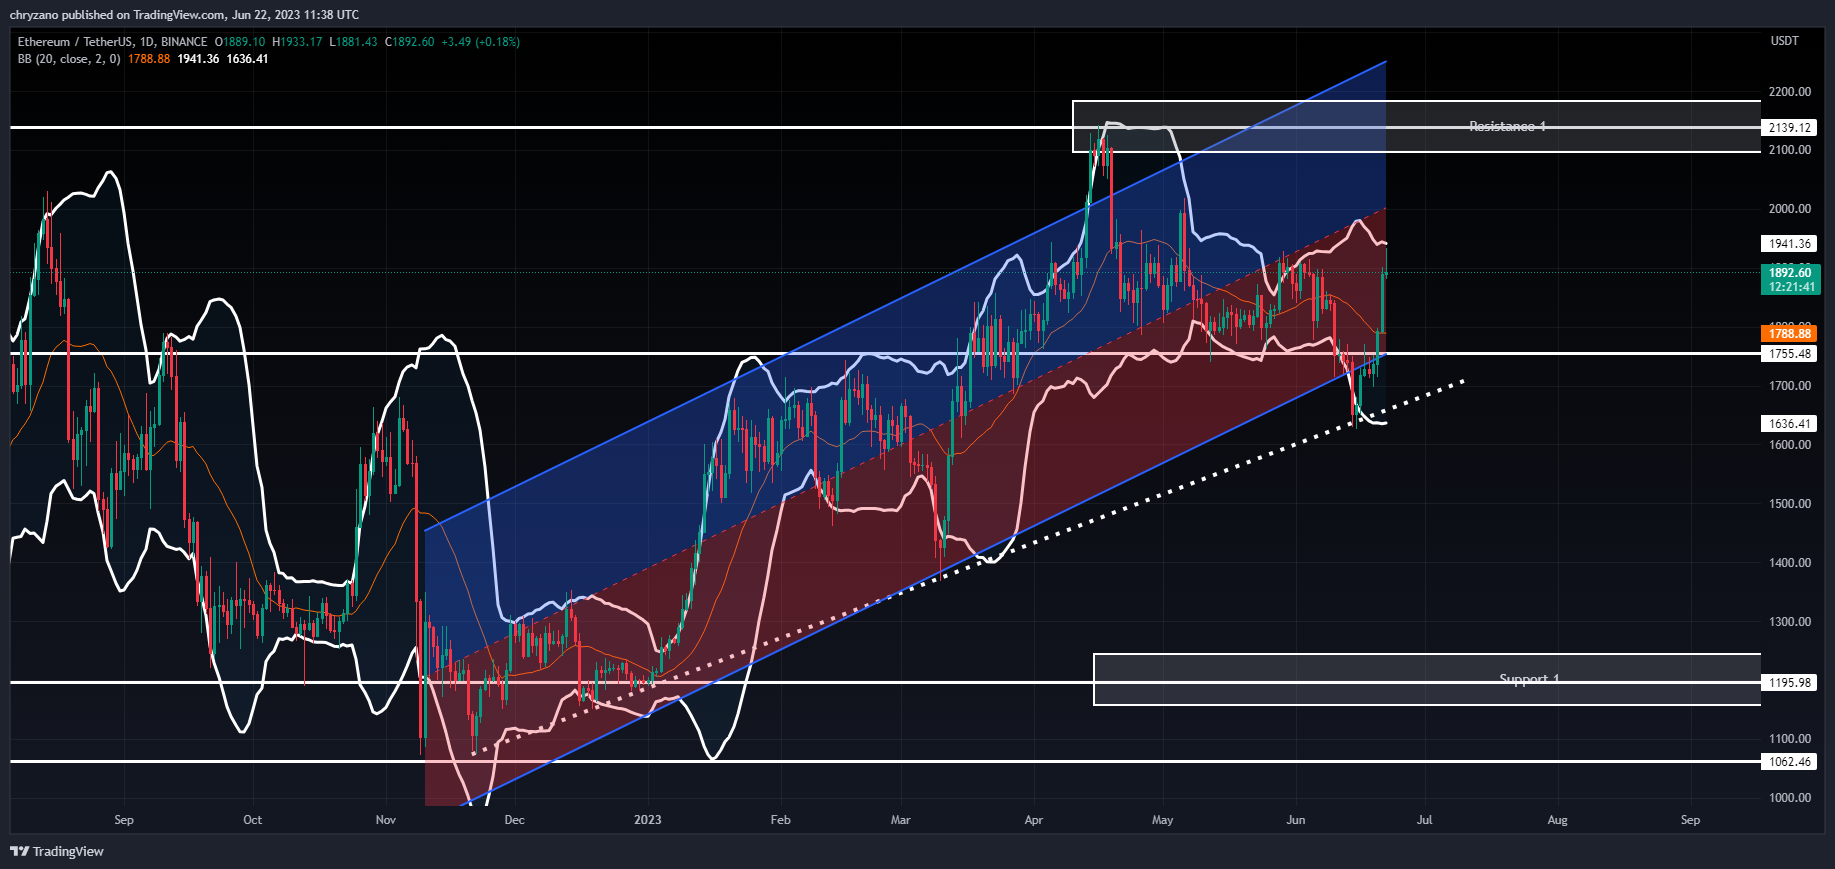
The above chart shows Ethereum fluctuating within a linear regression channel. Most of its activity seems to be in the top half of the channel. Whenever ETH broke into the lower section of the linear regression channel it was only to find support at the lower trend line.
Now that ETH is currently close to the median line of the trend channel, and looks to be moving up, it is quite evident to think, it may rise further and reach the top trend line of the regression channel — Resistance 1 at $2,140.
However, the Bollinger bands seem to contradict the above thesis. Since ETH has touched the upper Bollinger band, the chances of it rising further are quite slim. Hence, we may see ETH going through a period of correction. Moreover, the Bollinger bandwidth indicator which gives a reading of 0.17 is positioned parallel to the horizontal axis. As such there could be consolidation.
However, the chances for a surge can’t be neglected, when scrutinizing ETH’s spike in January 2023. In particular, ETH has this feature of continuously touching the band and when the market deems it as overbought, then there is a slight correction.
The correction often doesn’t even touch the SMA of the Bollinger band before the ETH starts to surge again. Hence, if there’s a slight correction for ETH, then, the traders may need to see the formation of bullish candlesticks before entering a long position.
In the event, ETH breaks below the SMA, then we may see it resorting to Support at the lower trend line of the linear regression channel. The preceding trend line presents an excellent entry point for buyers.
Disclaimer: The views and opinions, as well as all the information shared in this price analysis, are published in good faith. Readers must do their own research and due diligence. Any action taken by the reader is strictly at their own risk. Coin Edition and its affiliates will not be held liable for any direct or indirect damage or loss.
Disclaimer: The information presented in this article is for informational and educational purposes only. The article does not constitute financial advice or advice of any kind. Coin Edition is not responsible for any losses incurred as a result of the utilization of content, products, or services mentioned. Readers are advised to exercise caution before taking any action related to the company.


