
- Solana captured 97% of cumulative tokenized equities spot trading volume with over 200K onchain tokenized stock holders hitting a new record
- SoFi launched SoFiUSD on Solana, the first stablecoin from a US nationally chartered bank, with Cash App adding USDC on Solana the same week
- Futures volume jumped 58.64% to $5.56B while longs absorbed $3.89M in 24-hour liquidations against just $778.93K for shorts
Solana trades at $81.26 on June 1, down 1.29% as the SAR and Supertrend both sit overhead near $86 and $90 respectively, while a week of institutional launches and a 97% tokenized equities market share reading fail to push price back above its broken support zone.
SOL June 2026 Price Outlook: Channel Support at $76 Is the Last Floor Before Structure Breaks
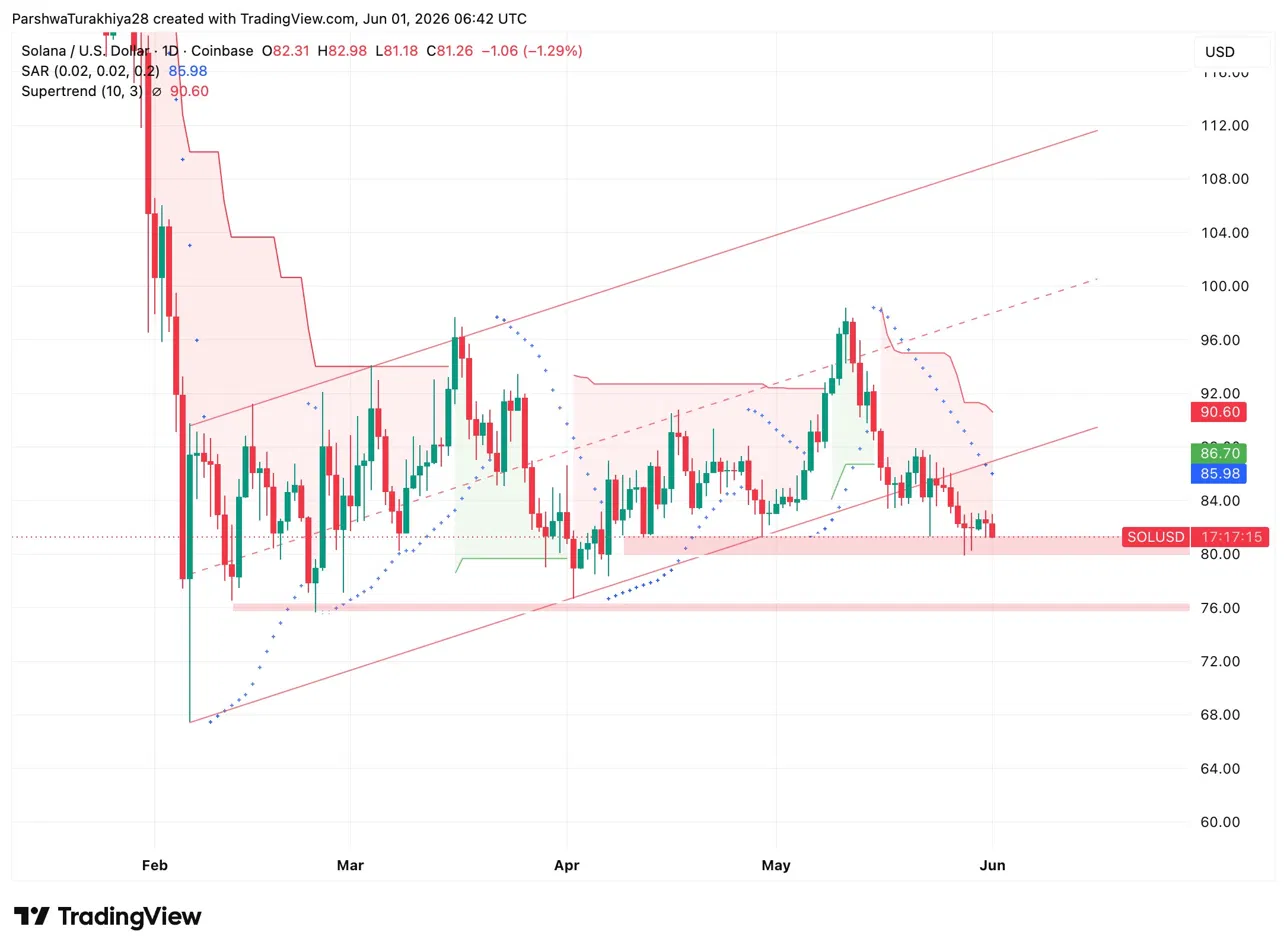
The daily chart has been building inside an ascending channel since the February lows, with the lower trendline rising from $68 toward current levels near $80. Price rejected sharply from the channel upper boundary near $98 in early May and has been grinding lower since. The SAR at $85.98 and the Supertrend at $90.60 are both above price, keeping the daily bias bearish heading into June.
The pink support zone between $76 and $80 is the level that matters most this month. It has provided a floor twice since February and aligns with the ascending channel’s lower trendline. A monthly close below $76 breaks the channel entirely and opens a move toward $68, where the channel origin sits. On the upside, reclaiming the SAR at $85.98 is the first step before the Supertrend at $90.60 becomes a realistic target. Above $90, the prior resistance zone near $96 to $98 is the next supply area.
SOL Key levels for June:
- Resistance: $85.98 (SAR), $90.60 (Supertrend), $96 to $98 (channel upper trendline)
- Support: $80 (current zone), $76 (pink demand zone), $68 (channel lower trendline)
Solana Owns 97% of Tokenized Equities Volume and the Institutional Pipeline Just Got Bigger
Solana captured 97% of cumulative tokenized equities spot trading volume this week while onchain tokenized stock holders crossed 200K for the first time. Real settlement is moving onto Solana rails, not speculative activity. The week’s launches made that case harder to ignore:
- SoFi launched SoFiUSD on Solana, the first stablecoin from a US nationally chartered bank
- Cash App rolled out USDC support on Solana in the same window
- Streamex and Orca launched 24/7 onchain secondary liquidity for regulated tokenized securities
- Mayan crossed $2.5B in stablecoins bridged to Solana across 600K transactions
- Solstice Finance crossed $500M in TVL
The next identifiable catalyst is June 16, when the Solana Summit: Washington x Wall Street takes place in Chicago, putting Solana’s infrastructure directly in front of institutional capital allocators at the midpoint of the month.
SOL Futures: Volume Up 58% but Longs Are Taking the Losses
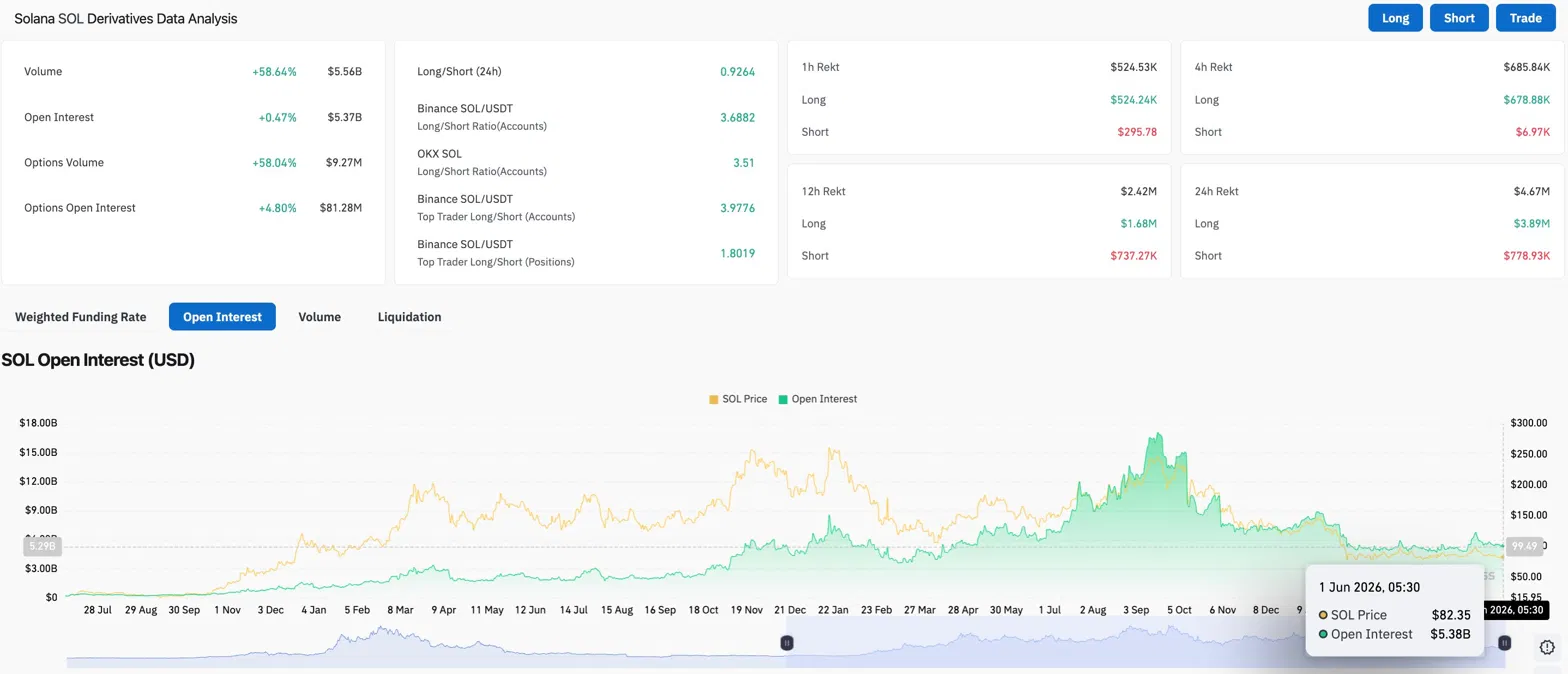
Futures volume jumped 58.64% to $5.56B while open interest barely moved, up just 0.47% to $5.37B. Volume surging while OI stays flat means traders are churning positions rather than building fresh conviction in either direction. Longs absorbed $3.89M in 24-hour liquidations against just $778.93K for shorts, bears are winning the futures battle right now.
Related: Cardano Price Prediction June 2026: Triangle Apex Forces a Decision This Month
The retail long/short ratio on Binance sits at 3.6882, meaning retail is heavily long despite the downtrend. Top traders are running a 3.9776 ratio by accounts but only 1.8019 by positions, suggesting professionals hold the long directional view but are sizing conservatively. A long-heavy retail crowd with price below both the SAR and Supertrend is the kind of setup that produces sharp moves lower before any recovery develops.
SOL Price Prediction for June 2026
- Upside: Holding the $76 to $80 demand zone through the first two weeks of June and reclaiming $85.98 on a weekly close opens a run toward $90.60 and the channel upper trendline near $96. The June 16 Washington x Wall Street summit is the most identifiable catalyst window for that move.
- Downside: A weekly close below $76 breaks the ascending channel and targets $68, with no meaningful support between those two levels. Continued long liquidation pressure with OI flat and retail heavily positioned long is the setup most likely to produce that outcome if macro conditions stay unfavorable.
Disclaimer: The information presented in this article is for informational and educational purposes only. The article does not constitute financial advice or advice of any kind. Coin Edition is not responsible for any losses incurred as a result of the utilization of content, products, or services mentioned. Readers are advised to exercise caution before taking any action related to the company.


