


- Ethereum classic price analysis shows a firm bearish trend.
- ETC entered a declining trendline following the rejection at $30.00.
- The critical support is found at $27.00.
Ethereum Classic (ETC) has been declining in the last three days after the general market trend. ETC trades at $28.40 and is down by 17.35% in the last 24 hours. The market capitalization has also decreased to $3.83 billion, and the 24-hour trading volume is at $1,146,726,532.79.
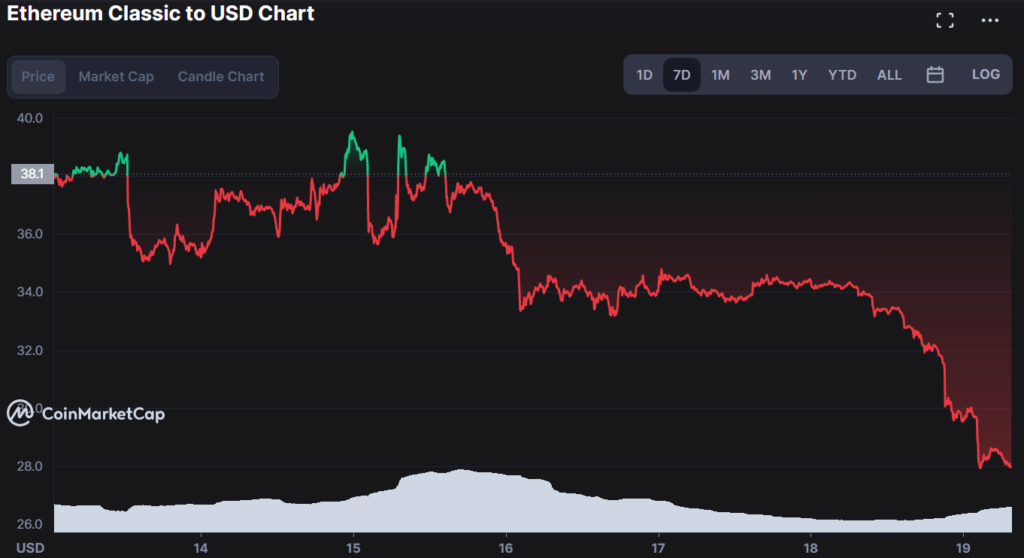
The current trend is likely to prevail as ETH and BTC are still under selling pressure. The Fibonacci retracement level highlights the support and resistance areas. The current support levels are $27.00 and $25.50, and a break below these levels could see ETH enter into a bearish trend. On the other hand, if the prices move above $30.00, it would invalidate the current bearish trend.
On the daily chart, the ETC price is substantially following a descending trend line, having found resistance at $30.00. This downtrend is likely to continue as the price is trading below the moving averages. The RSI indicator is also in the oversold region, which indicates that selling pressure could persist in the market.
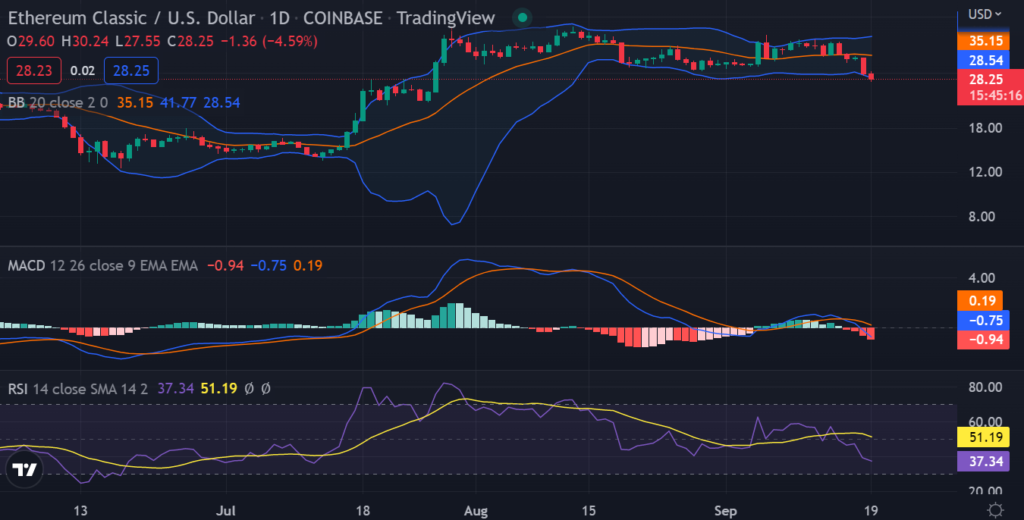
The Bollinger bands on the daily chart are starting to contract, which is an indication of decreased market volatility. The lower band resides at $27.32, while the upper band is at $29.48.These levels act as immediate support and resistance levels for the prices.
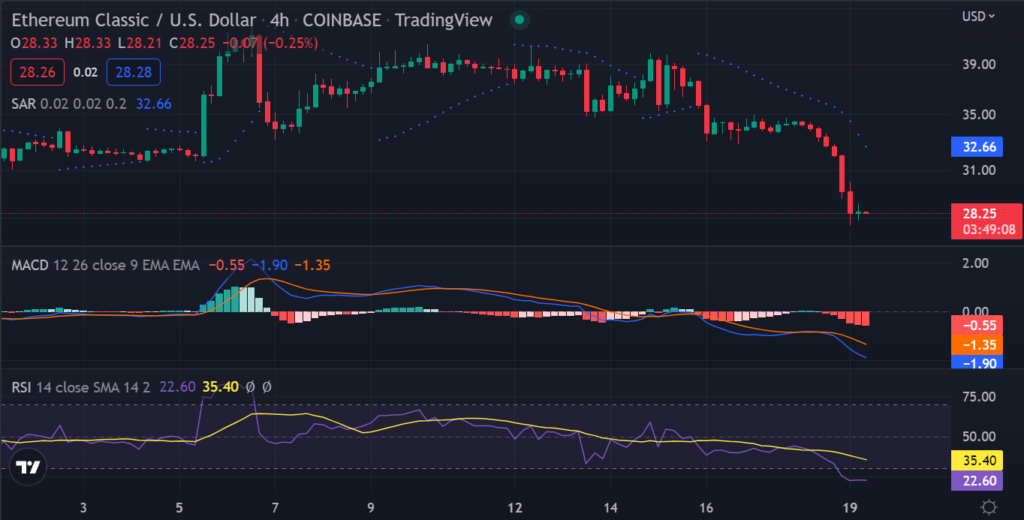
The MACD histogram is also declining, indicating that bears have the upper hand in the market. Moreover, the prices have recently formed a bearish engulfing candlestick pattern, which is likely to push prices lower. On the 4-hour chart, a clear bearish trendline is visible as the prices have been consistently declining. The technical indicators are pointing to the bearish sentiment of the market as the RSI indicator is in the oversold region. The MACD histogram is also below the zero line, which indicates that selling pressure could continue.
The 50-day MA is currently at $30.70, and the 200-day MA is at $33.40. These levels could act as key resistance levels in the near future as the prices are likely to head lower in the next few days.
The Parabolic SAR indicator is also following a descending trend, which indicates that selling pressure could continue in the market.
Furthermore, the ETC price is likely to continue declining as the technical indicators are pointing to bearish market sentiment. However, the market might rebound if the prices move above the $30.00 level.
Disclaimer: The views and opinions, as well as all the information shared in this price analysis, are published in good faith. Readers must do their own research and due diligence. Any action taken by the reader is strictly at their own risk. Coin Edition and its affiliates will not be held liable for any direct or indirect damage or loss.
Disclaimer: The information presented in this article is for informational and educational purposes only. The article does not constitute financial advice or advice of any kind. Coin Edition is not responsible for any losses incurred as a result of the utilization of content, products, or services mentioned. Readers are advised to exercise caution before taking any action related to the company.

: What Happens If You Use an Unlicensed Platform?")


