


- Ethereum remains below key EMAs as sellers defend major resistance levels.
- Open interest stabilization signals cautious trader participation and reduced leverage.
- Persistent exchange outflows suggest accumulation despite weak market momentum.
Ethereum continues to trade under pressure as the cryptocurrency struggles to regain bullish momentum. Although ETH has bounced from recent lows, technical indicators suggest that sellers still maintain the upper hand.
Ethereum Faces Resistance Despite Recent Rebound
ETH currently trades near $1,673 after recovering from a sharp decline that pushed prices toward $1,505 earlier this month. While the rebound offered temporary relief, buyers have not yet demonstrated enough strength to shift the broader trend.
The asset remains below its major moving averages, which continue to point lower. The 20-day EMA near $1,745 represents the first significant hurdle for bulls. Moreover, the 50-day EMA at $1,892 remains a major obstacle that could limit upside attempts.
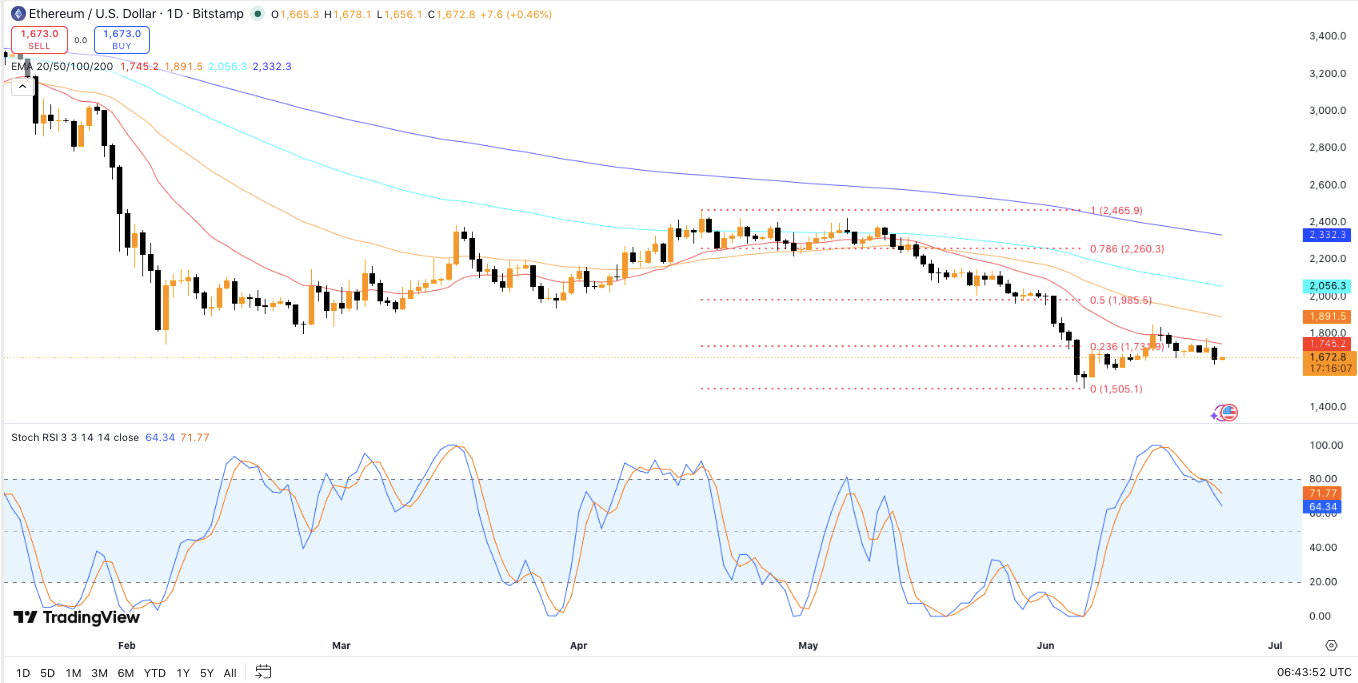
Technical indicators also show fading momentum. The Stochastic RSI recently turned lower after reaching elevated levels, signaling that buying pressure has weakened. Consequently, traders may see additional consolidation before Ethereum attempts another breakout.
Related: Bitway (BTW) Price Prediction 2026, 2027, 2028, 2029, 2030-2050
A move above $1,745 would improve short-term sentiment. However, a stronger recovery would likely require a sustained push beyond $1,892. Beyond that level, resistance appears near $1,986 and $2,260, while the 200-day EMA around $2,332 remains the key long-term target.
Open Interest Signals Cautious Market Participation
Ethereum’s derivatives market paints a mixed picture. Open interest currently stands near $23.74 billion, significantly below previous cycle highs that exceeded $60 billion.
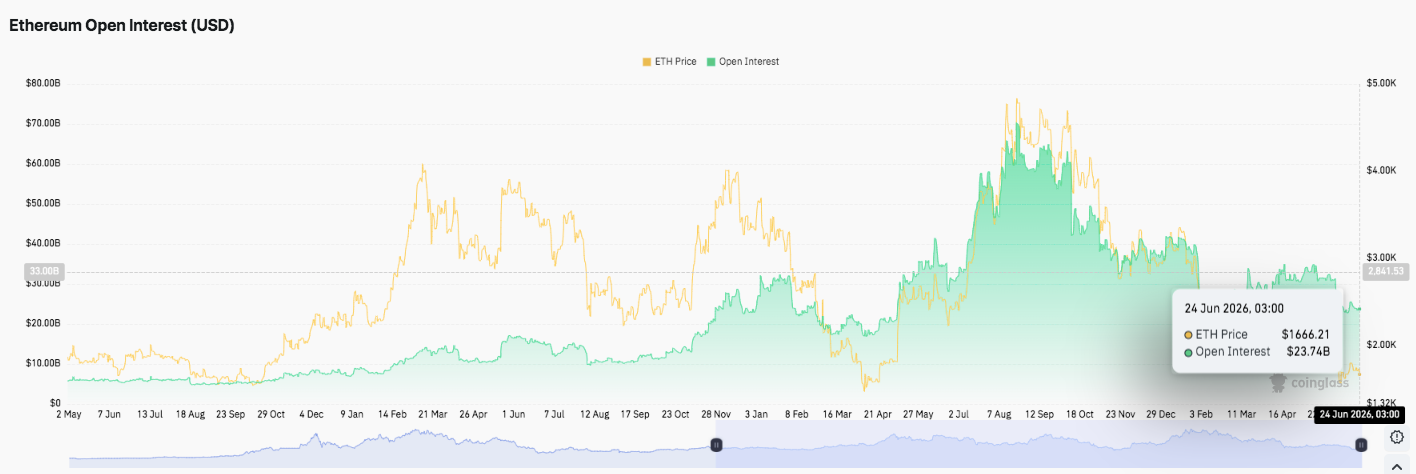
Earlier in the year, rising open interest accompanied strong price gains, reflecting aggressive positioning by traders. However, subsequent declines revealed widespread profit-taking and liquidation activity as the market corrected.
Recently, open interest has stabilized rather than continued falling. This trend suggests that traders remain active, though they appear less willing to deploy excessive leverage. Hence, market participants seem to be waiting for a stronger directional signal before increasing exposure.
Exchange Flows Suggest Ongoing Accumulation
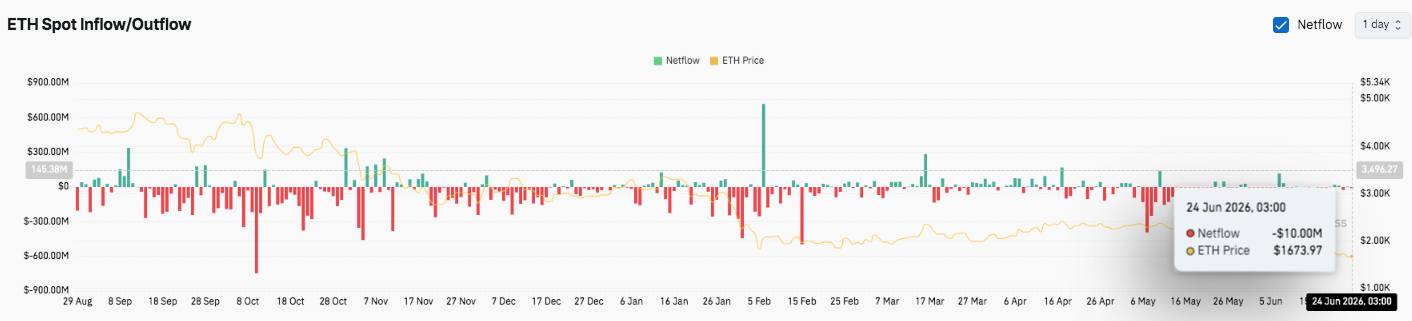
Exchange activity provides another important clue. Over recent months, Ethereum has experienced persistent net outflows from trading platforms. These withdrawals often indicate investors moving assets into private wallets rather than preparing to sell.
Related: Cardano Price Prediction: Hoskinson Reveals SpaceX Talks While ADA Quietly Bleeds Out
Several large outflow events surpassed $500 million, highlighting periods of strong accumulation. Additionally, the latest netflow reading showed a modest $10 million outflow, suggesting selling pressure remains limited.
Technical Outlook for Ethereum Price
Key levels remain crucial as Ethereum attempts to stabilize above a major support zone while trading below key moving averages.
Upside levels: $1,745 (20-day EMA) serves as the first resistance level, followed by $1,892 (50-day EMA) and $1,986 (0.5 Fibonacci retracement). A sustained breakout above these barriers could open the door toward $2,260 and eventually $2,332, where the 200-day EMA stands as the primary medium-term resistance.
Downside levels: $1,673 remains the immediate support area, while $1,505 represents the most important near-term floor. A decisive break below $1,505 could accelerate selling pressure and expose Ethereum to deeper downside territory.
Resistance ceiling: The $2,332 level, aligned with the 200-day EMA, remains the key threshold bulls must reclaim to confirm a broader trend reversal and restore medium-term bullish momentum.
The technical structure shows Ethereum attempting to build a base after a prolonged decline. However, the asset continues to trade below all major moving averages, indicating that bears still control the broader trend. Momentum indicators also suggest that recent gains may represent a relief rally rather than the start of a sustained uptrend.
Will Ethereum Go Up?
Ethereum’s next move will likely depend on whether buyers can defend the $1,505 support zone while pushing price back above the 20-day EMA at $1,745. Growing exchange outflows suggest long-term holders continue accumulating, while stable open interest indicates traders remain engaged despite reduced leverage.
If bullish momentum strengthens and ETH reclaims $1,892, the market could target $1,986 and potentially $2,260 in the coming weeks. However, failure to maintain support above $1,505 would weaken the recovery narrative and increase the risk of another leg lower.
Related: Shiba Inu Price Prediction: 800B SHIB Floods Exchanges While Burns Jump 56% in 24 Hours
For now, Ethereum remains at a pivotal technical juncture. Accumulation signals offer cautious optimism, but a confirmed breakout above key resistance levels is still needed before a sustainable bullish trend can emerge.
Disclaimer: The information presented in this article is for informational and educational purposes only. The article does not constitute financial advice or advice of any kind. Coin Edition is not responsible for any losses incurred as a result of the utilization of content, products, or services mentioned. Readers are advised to exercise caution before taking any action related to the company.


