



- Ethereum trades near $2,115 as the weekly chart approaches monthly breaker support at $2,000.
- A move below $2,000 could sweep liquidity, but a recovery remains unconfirmed on the chart.
- ETH pulled back from $2,700 and must reclaim resistance before a move toward $3,700.
Ethereum is nearing the $2,000 support region, with the weekly chart pointing to a possible liquidity sweep before a recovery toward the $3,700 monthly order block. For that move to develop, buyers would need to hold the monthly breaker and push ETH back above nearby resistance after its latest decline.
On the Binance ETH/USDT weekly chart from TradingView, Ethereum was trading near $2,114.95. The current candle showed a low of $2,083.10 and a high of $2,160.50. Price has fallen considerably since its recent climb toward $2,700, leaving ETH closer to the support area marked on the chart.
| Support Level Price | Significance |
| Immediate Support | $2,105 first downside level |
| Secondary Support | $2,043 Next support |
| Monthly Breaker | $2,000 potential liquidity sweep |
| Lower Support | $1,983 bearish continuation risk |
Ethereum Price Nears $2,000 Monthly Breaker as Sweep Looms
The $2,000 level is now coming into focus as Ethereum moves toward a monthly breaker marked just below its current price. The area represents an earlier price structure that traders watch for signs of changing buying or selling pressure when the market returns to test it.
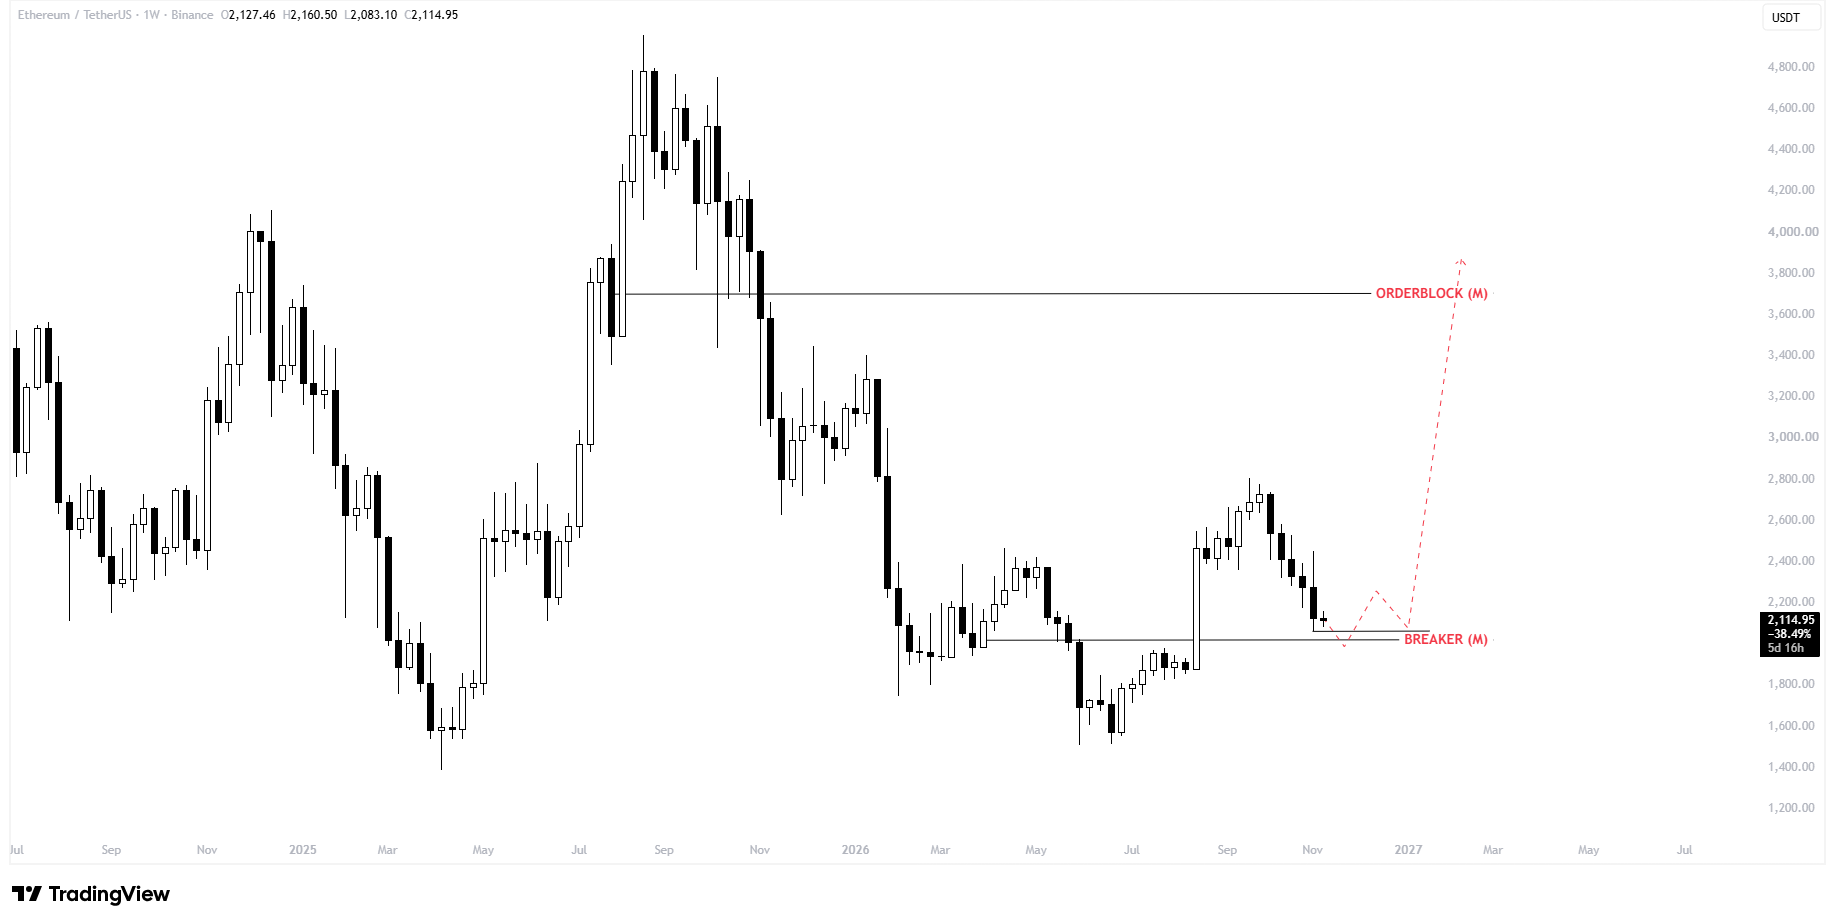
The chart’s dashed projection shows ETH briefly falling beneath the breaker before recovering above it. Such a move could sweep stops positioned below support, but the illustration does not establish that those orders exist or that a sweep will occur. Yet a quick reclaim would strengthen the bullish interpretation, while sustained trading below $2,000 would weaken it.
The area also overlaps with a separate technical reference. A November 5 analysis placed Ethereum’s weekly Supertrend support near $2,008, although it noted that momentum had weakened as the price retreated. That convergence makes the $2,000 region important without guaranteeing a rebound.
Follow us on X for real-time crypto updates.
Ethereum Price Faces Resistance Before the $3,700 Target
Meanwhile, Ethereum’s weekly structure remains mixed. The chart shows a rebound from midyear lows around $1,500, followed by a climb toward $2,700 and a renewed decline. That sequence leaves buyers needing more than a brief support bounce to demonstrate a lasting trend change.
Near-term resistance lies around $2,160–$2,200, followed by the broader $2,400 area. Above the barrier, a recovery toward $2,700 would test the previous rally high. Only after clearing the intermediate structure would the monthly order block around $3,700 become a credible higher-timeframe objective. That target represents roughly 75% upside from the chart’s $2,115 reference price, rather than a confirmed forecast.
For now, the proposed liquidity sweep remains unconfirmed. The next important signal is whether Ethereum rejects prices below the monthly breaker and closes back above support or instead loses $2,000 and extends the existing pullback.
Ethereum Resistance Levels
| Resistance Level | Price | Significance |
| Immediate Resistance | $2,165 | First recovery hurdle |
| Secondary Resistance | $2,211 | Bullish confirmation level |
| Major Resistance | $2,400 | Broader recovery barrier |
| Previous Rally High | $2,700 | Higher resistance |
| Monthly Order Block | $3,700 | Extended bullish target |
Bullish Scenario
ETH could dip below $2,000 before recovering, as the chart suggests a possible liquidity sweep around the monthly breaker. If buyers push the price back above $2,211, attention would shift to $2,700, with the larger target at $3,700.
Bearish Scenario
On the other hand, a drop below $2,000 would put the monthly breaker under pressure. Should ETH stay beneath that level, $1,983 becomes the next support to watch, leaving the expected recovery in doubt.
Neutral Scenario
Meanwhile, ETH may remain caught between $2,000 and $2,211 for now. Trading within that range would leave both the bullish recovery and a deeper decline unconfirmed.
FAQs
The $3,700 target remains on the chart, although ETH would first need to move past nearby resistance.
The monthly breaker around $2,000 is the main support area to watch.
A brief dip could sweep liquidity, but continued weakness would bring $1,983 into focus.
The first hurdle sits near $2,165. Beyond that, traders are watching $2,211 and $2,400.
Subscribe to our YouTube channel for the latest crypto news.
Related: XRP Price Analysis: Bearish EMA Crossover Puts $0.9862 Support at Risk
Disclaimer: The information presented in this article is for informational and educational purposes only. The article does not constitute financial advice or advice of any kind. Coin Edition is not responsible for any losses incurred as a result of the utilization of content, products, or services mentioned. Readers are advised to exercise caution before taking any action related to the company.