



- Ethereum climbed 3% from $2,372 to $2,444 but remained below $2,478 resistance.
- CoinGlass showed $18.15M in resting bids near $2,378–$2,400, not executed trades.
- Holding $2,390–$2,400 keeps $2,478 and $2,505 in focus, while losing $2,372 weakens the setup.
Ethereum traded near $2,444 on October 21 after rebounding from the daily range low at $2,372. The recovery places a stacked $2,390–$2,400 imbalance at the center of the next technical test. Holding that zone could open a route toward $2,478 and $2,505, although neither upside level has been reclaimed.
Ethereum Technical Overview
| Indicator | Value |
| Current Price | $2,444 |
| Daily Range Low | $2,372 |
| Key Imbalance | $2,390–$2,400 |
| Upside Target | $2,505 |
ETH Rebounds From $2,372 as Bulls Target $2,478 Resistance
ETH rose approximately 3% from $2,372 before momentum stalled near $2,450. Four-hour candles subsequently consolidated beneath $2,478, the daily range high, indicating a strong buying reaction from the lower portion of the range despite persistent overhead resistance.
However, the chart still shows lower highs, so the recovery has not yet established a bullish reversal. A sustained move above $2,478 would bring the next marked level, $2,505, into focus. That level sits $27, or about 1.1%, above the range high.
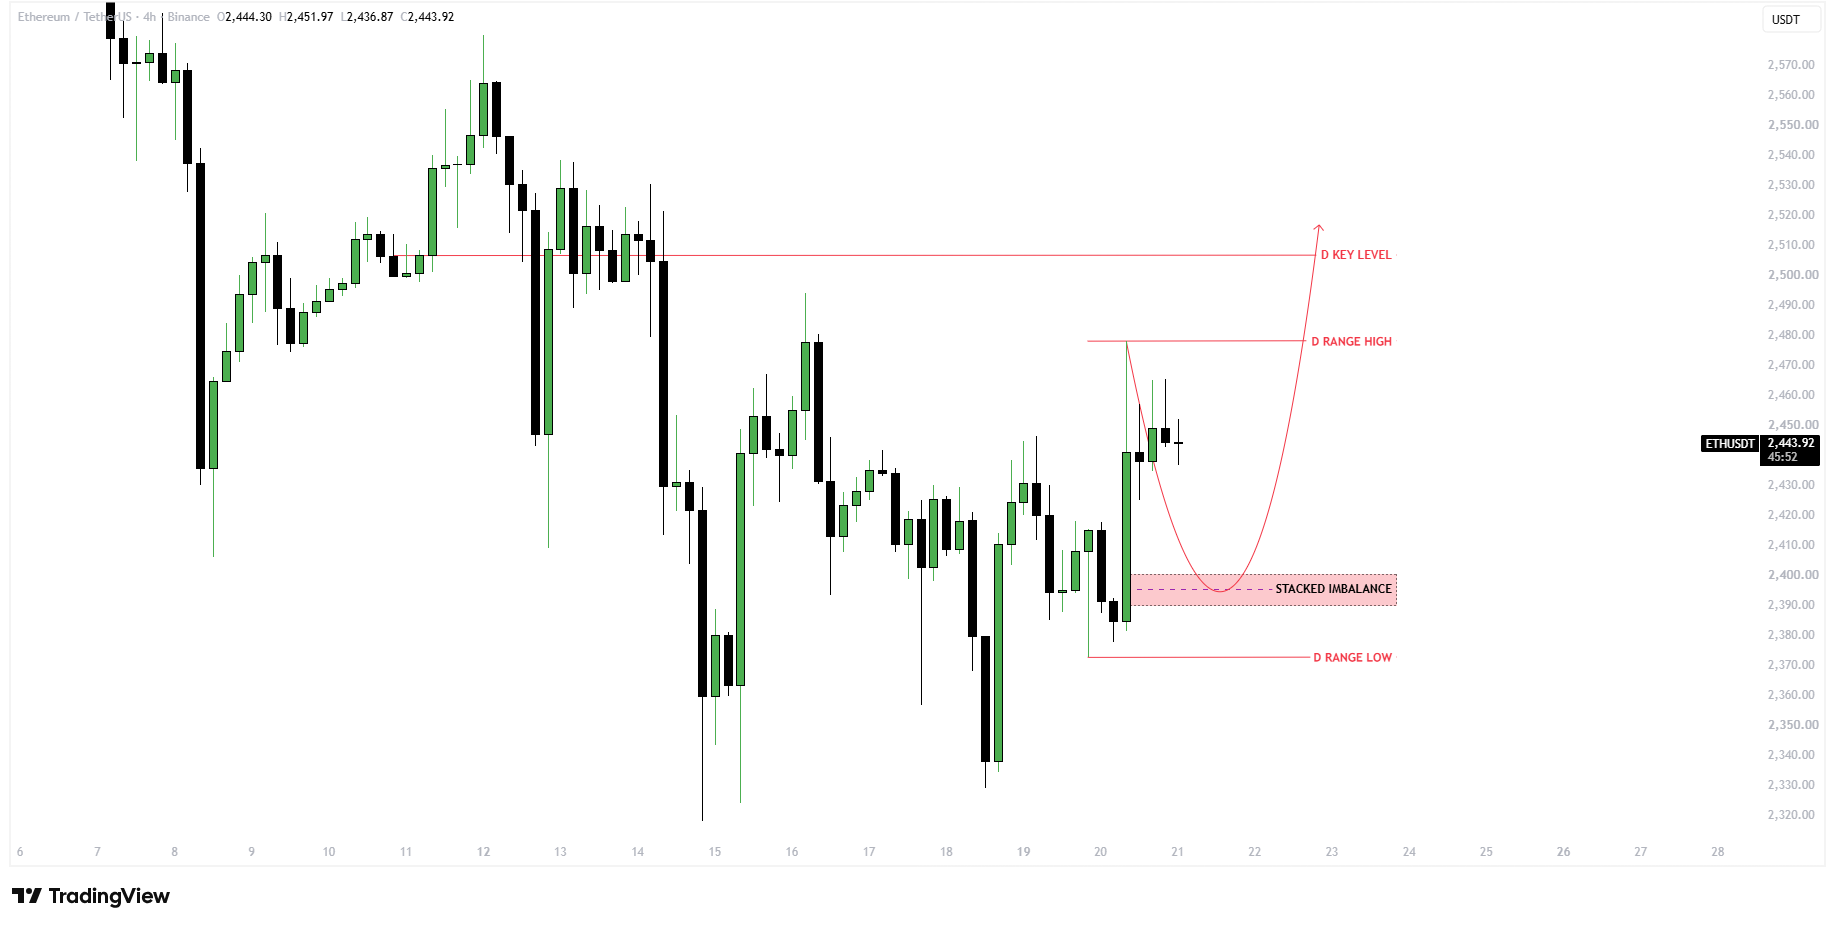
Meanwhile, repeated rebounds around $2,400 despite continued exchange-traded fund outflows highlight the level’s technical importance. However, those previous reactions do not guarantee renewed buying support during another pullback.
CoinGlass Records $18.15M in Bids Between $2,378 and $2,400
Supporting the focus on this zone, CoinGlass’s four-hour snapshot showed $4.63 million in resting perpetual bids at $2,400 and another $6.70 million at $2,397. Additional bids worth $6.82 million appeared near $2,378, just above the daily range low.
Together, these orders totaled $18.15 million in displayed liquidity. However, they represent unfilled orders rather than completed purchases and remain subject to cancellation.
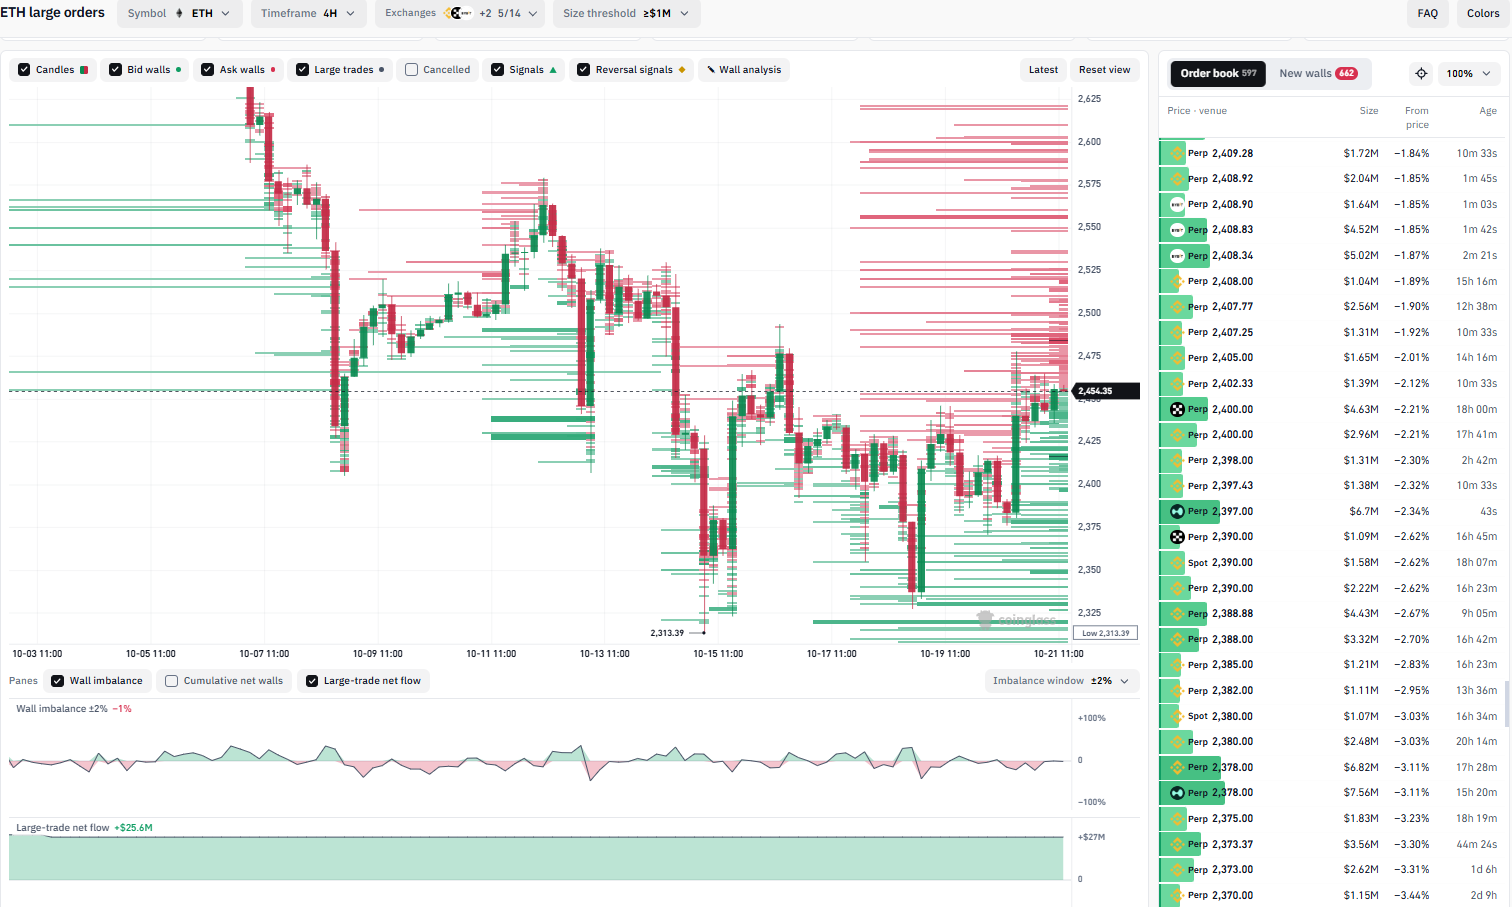
Meanwhile, the dashboard recorded $25.6 million in positive large-trade net flow, although its order-wall imbalance within 2% of the quoted price stood at negative 1%. Consequently, the contrasting readings indicate positive large-trade flow alongside slightly heavier displayed sell-side liquidity.
ETH Faces $2,478 Resistance and $2,372 Invalidation
Against this backdrop, the $2,390–$2,400 imbalance remains a crucial support zone during potential pullbacks. A rejection of lower prices, followed by a four-hour close above this zone, would strengthen the bullish recovery case.
Subsequently, sustained trading above $2,478 would bring the $2,505 target into focus. However, a brief breakout without sustained momentum could signal a liquidity sweep rather than a confirmed bullish continuation.
Conversely, a sustained breakdown below $2,390 would weaken the recovery outlook. Further acceptance beneath the $2,372 daily range low would invalidate the immediate bullish setup, exposing the October swing area near $2,330.
Key Levels to Watch
| Level | Significance |
| $2,505 | Bullish target |
| $2,478 | Daily range high |
| $2,390–$2,400 | Key support zone |
| $2,372 | Bullish invalidation |
| $2,330 | Downside reference |
Bullish Scenario
Defending $2,390–$2,400, followed by a sustained break above $2,478, could support an advance toward $2,505.
Bearish Scenario
A sustained break below $2,390, followed by acceptance beneath $2,372, would weaken the bullish setup and expose $2,330.
FAQs
The daily range is high at $2,478.
It marks a potential buying reaction zone during pullbacks.
$2,505, following a sustained breakout above $2,478.
Acceptance below $2,372 would invalidate the immediate bullish setup.
Related: Bitcoin Price Analysis: BTC Drops 3% as $82,270 Caps Gains, Whales Crowd $80K
Disclaimer: The information presented in this article is for informational and educational purposes only. The article does not constitute financial advice or advice of any kind. Coin Edition is not responsible for any losses incurred as a result of the utilization of content, products, or services mentioned. Readers are advised to exercise caution before taking any action related to the company.