

- Ethereum sentiment hit a monthly low as past bearish phases preceded 14% and 7% rebounds.
- Bearish Ethereum sentiment alone does not signal an immediate recovery, Santiment says.
- MACD remained positive while the RSI held above 50, signaling sustained buying momentum.
Ethereum price remained under pressure as social sentiment across major crypto platforms dropped to one of its weakest levels in recent weeks. However, historical data shared by Santiment showed that similar periods of growing pessimism have previously been followed by short-term price recoveries.
At the same time, separate market data highlighted that institutional ETF demand continued to rise beneath the surface.
Ethereum Price Sentiment Turns Bearish Again
Santiment reported that Ethereum’s positive-to-negative social commentary ratio turned bearish for the third time within the past month. The data tracked discussions across X, Reddit, Telegram, and other crypto communities while comparing sentiment with Ethereum’s market performance.
According to the chart, previous sentiment declines produced different outcomes. On June 27, bearish social commentary was followed by a 14% increase in Ethereum’s price over the next seven days. A similar pattern appeared on July 11, when the asset gained 7% during the following four days after another period of negative sentiment.
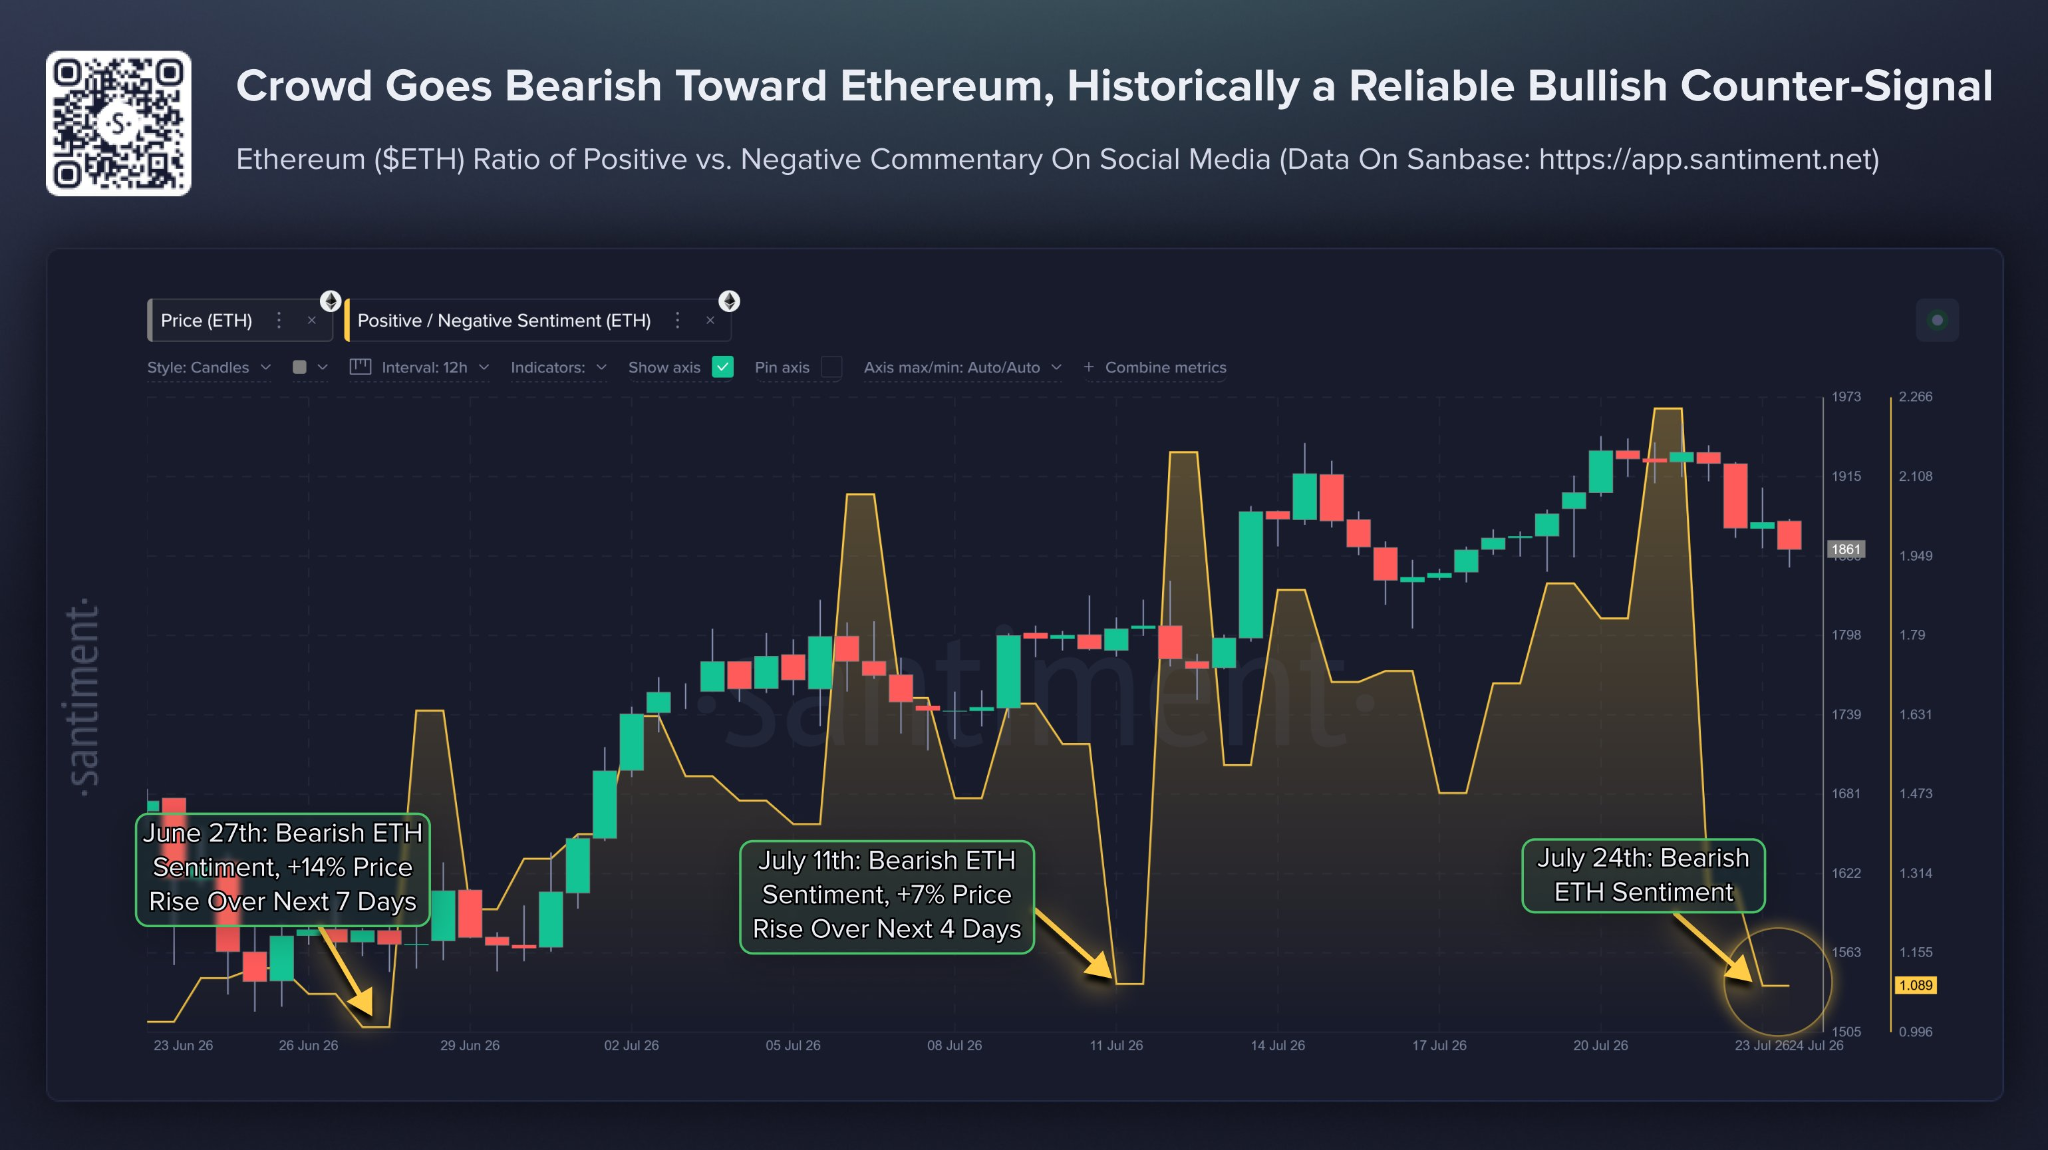
The latest reading showed sentiment falling to one of its lowest levels in the observed period as the Ethereum price traded around $1,856 after retreating from recent highs. Santiment noted that negative sentiment alone does not predict an immediate recovery.
However, the firm stated that earlier periods of widespread frustration coincided with later price rebounds while ETF inflows, Layer-2 activity, and protocol development remained active.
Ethereum Technical Indicators Continue to Show Average Strength
The Moving Average Convergence Divergence (MACD) remained in positive territory, with the MACD line at 37.88 and the signal line at 37.84. However, the flattening histogram showed that buying momentum had weakened.
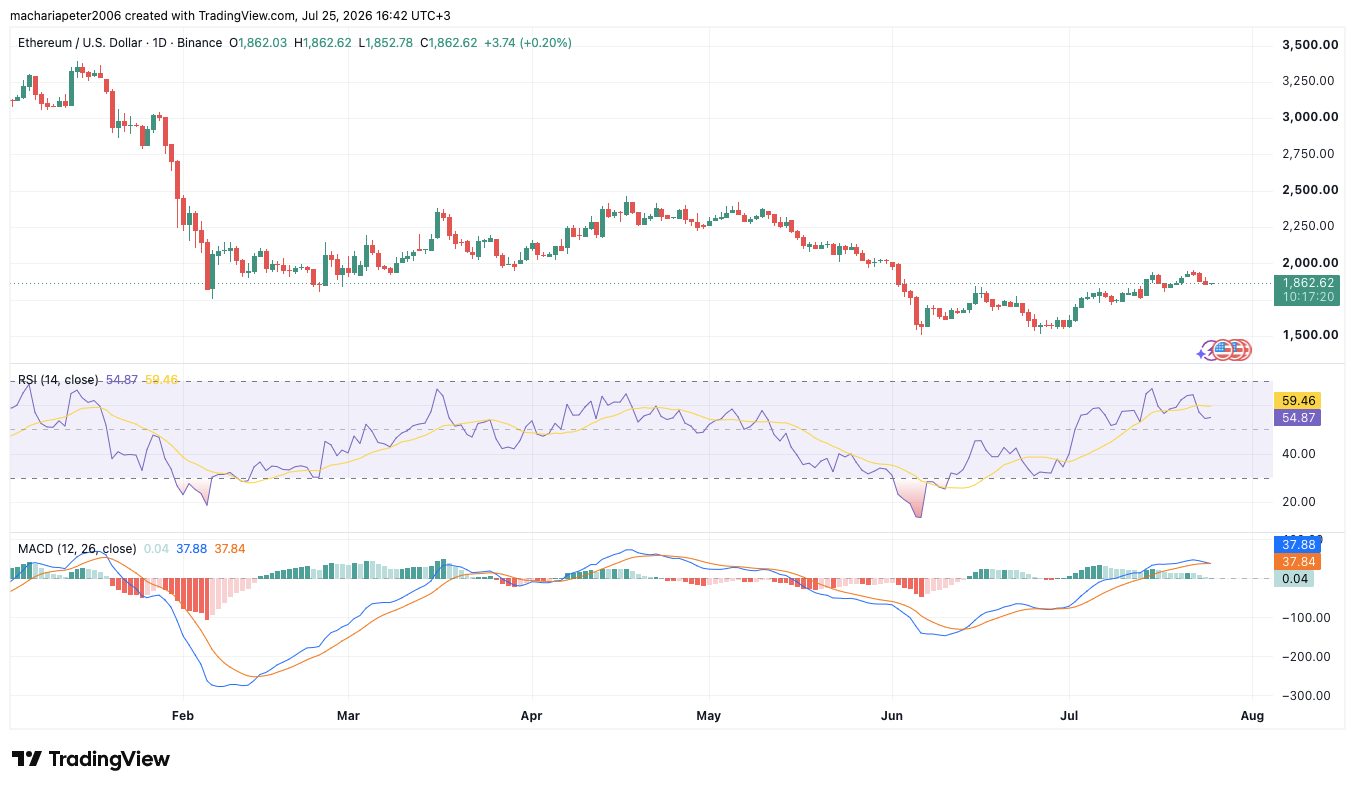
The 14-day RSI was 54.87, staying above the neutral 50 mark to indicate moderate buying strength. However, it has retreated from recent highs above 60, signaling easing momentum after Ethereum neared the $1,900 resistance level.
Despite weakening social sentiment, Ethereum continues to show signs of underlying resilience. Historical sentiment patterns, steady ETF demand, and neutral-to-positive technical indicators suggest that investors remain active, even as the market waits for a clearer directional catalyst.
Related: Ethereum Price Prediction: Can ETH Break $2,000 as ETF Demand Splits From Bitcoin?
Disclaimer: The information presented in this article is for informational and educational purposes only. The article does not constitute financial advice or advice of any kind. Coin Edition is not responsible for any losses incurred as a result of the utilization of content, products, or services mentioned. Readers are advised to exercise caution before taking any action related to the company.