

- CryptoQuant’s Julio Moreno says ETH is 17% below its realized price cost basis but only 2 of 5 bottom metrics have confirmed
- Spot ETH ETFs logged $26.32M in inflows on July 23, holding positive while BTC ETFs recorded a $225M outflow on the same day
- Ali Charts flagged $1,850 as the critical channel support, with $2,060 as the upside target if that level holds
Ethereum trades at $1,896.60 on July 24, up 1.05%, holding above the 0.382 Fibonacci level as spot ETFs continue attracting inflows even on a day Bitcoin funds bled $225M. CryptoQuant’s head of research Julio Moreno published a five-metric framework for calling the ETH bottom, with two signals confirmed and three still in neutral territory.
Ethereum Price Today: What the Chart Shows at $1,896?
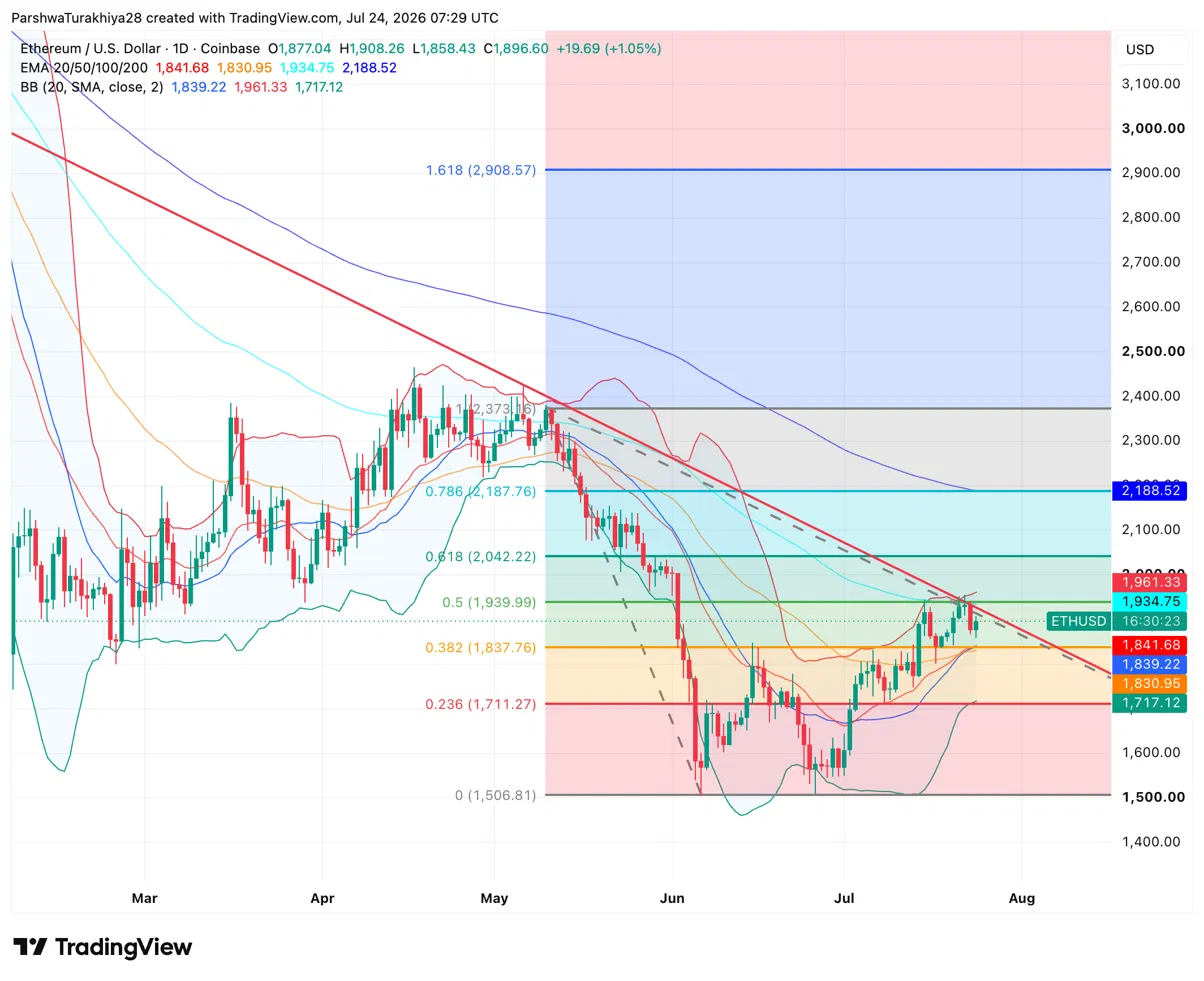
Ethereum is pressing against one of the most technically layered resistance zones in the current cycle. The 100-day EMA at $1,934.75 and the 0.5 Fibonacci retracement level at $1,939.99 have converged into almost the same price, and a descending trendline from May’s peak slopes directly through that area. The Bollinger upper band at $1,961.33 sits just above, making the $1,934 to $1,961 range a triple-layered ceiling that ETH has not managed to close above yet.
Related: Bitcoin Price Prediction: The Metric That Called Every Bitcoin Bottom Since 2015 Just Fired Again
The floor below the current price is equally well-defined. The 20-day EMA at $1,841.68 and the Bollinger midline at $1,839.22 have pulled into a tight band, with the 0.382 Fibonacci at $1,837.76 sitting inside the same zone. That $1,837 to $1,842 cluster is the same area Ali Charts flagged at $1,850 as the critical channel support. Losing this zone opens a drop toward the lower Bollinger Band at $1,717.12 and, below that, the Fibonacci zero point at $1,506.81.
What Are The Key Support And Resistance Levels For ETH Today?
- Support at $1,841.68 on the 20-day EMA and $1,837.76 on the 0.382 Fibonacci
- Resistance at $1,934.75 on the 100-day EMA and $1,939.99 on the 0.5 Fibonacci
- Extended resistance at $1,961.33 on the Bollinger upper band and $2,042.22 on the 0.618 Fibonacci
- Key floor at $1,717.12 on the lower Bollinger Band and $1,506.81 at the Fibonacci zero point
CryptoQuant’s Five-Metric ETH Bottom Framework: Where Things Stand
Appearing on the Milk Road Show with host John Gillan on July 22, Moreno presented a five-metric framework for identifying a genuine ETH bottom, specifically one that signals outperformance relative to Bitcoin rather than just a nominal price low. As of July 24, two signals have confirmed and three remain in neutral territory.
The two confirmed signals:
The first is ETH’s realized price, the average cost basis across all holders weighted by on-chain movement. ETH currently trades roughly 17% below that level, placing it in historically undervalued territory. The upper band of CryptoQuant’s realized price model sits near $5,000 and the lower band near $1,200, giving the current level an asymmetric risk-to-reward profile for long-term buyers.
The second confirmed signal is the ETH/BTC spot volume ratio, which Moreno described as reaching bottoming levels. Speculative trading demand for ETH relative to Bitcoin has been fully cleared out, a condition that has historically preceded ETH outperformance in prior market cycles.
The three signals still in neutral:
| Signal | Status | What It Measures |
| ETH/BTC MVRV ratio | Neutral | Relative over/undervaluation vs. BTC on a market-value basis |
| Exchange inflow ratio (ETH vs. BTC) | Neutral | Relative selling pressure between the two assets |
| ETF holdings ratio | Neutral | Relative institutional demand via regulated products |
All three improved from peak overvaluation seen earlier but have not reached the extreme undervaluation readings that have historically marked final cycle bottoms.
Moreno’s conclusion is precise: ETH is cheaper but not yet fully capitulated against Bitcoin. The absolute bottom for ETH outperformance may require more time or additional relative underperformance against BTC before the setup fully confirms.
“ETH is currently 17% below its realized price, which is historically an undervalued zone, but two of the five bottom indicators have confirmed while three remain in neutral territory”
— Julio Moreno, Head of Research at CryptoQuant
ETH ETFs Held Positive While BTC Bled
Spot Ethereum ETFs logged $26.32M in net inflows on July 23 according to SoSoValue, holding positive on the same day Bitcoin ETFs recorded a $225.18M outflow.
BlackRock’s ETHA led with $8.49M, Fidelity’s FETH added $14.93M, and BlackRock’s ETHB contributed $2.90M. Cumulative net inflows across all ten products now sit at $11.25B with total net assets at $10.32B.
The divergence between ETH and BTC ETF flows on the same session supports Moreno’s observation that relative demand for ETH at the margin may be starting to improve, one of the three metrics he is watching for confirmation of a full bottom.
Ethereum Price Prediction: Upside and Downside Targets

- Upside case: ETH holds the $1,837 to $1,842 support cluster, clears the 100-day EMA and 0.5 Fibonacci resistance at $1,934 to $1,940, and continued ETF inflow divergence from BTC confirms improving relative demand toward the 0.618 Fibonacci at $2,042 and Ali Charts’ channel target near $2,060.
- Downside case: The descending trendline and 100-day EMA reject price again, ETH loses the $1,837 support zone, and Moreno’s remaining three neutral metrics fail to confirm before the FOMC meeting on July 29, sending price toward the lower Bollinger Band at $1,717.
Related: Akedo Price Prediction: Can AKE Extend Its 1,500% Rally Above $0.0030?
Disclaimer: The information presented in this article is for informational and educational purposes only. The article does not constitute financial advice or advice of any kind. Coin Edition is not responsible for any losses incurred as a result of the utilization of content, products, or services mentioned. Readers are advised to exercise caution before taking any action related to the company.