

- Ethereum’s four-hour CVD improved toward -4.08M despite a lower price low near $2,400.
- Ethereum liquidations hit $356 million as U.S. spot Ether ETFs shed $72.5 million.
- ETH’s $2,807.65 upside target hinges on clearing resistance from $2,500 to $2,800.
Ethereum rebounded toward $2,500 after the October 8 selloff, with the October 9 Binance ETH/USDT four-hour chart recording $2,494.04. A bullish CVD divergence emerged alongside the recovery, but resistance still needs to break before the move can be confirmed.
| CHART PRICE | CVD RECOVERY | KEY SUPPORT | UPSIDE TARGET |
| $2,494.04 | −4.08 million | $2,400–$2,410 | $2,807.65 |
Four-Hour CVD Divergence Forms During the Liquidity Sweep
The October 8 decline swept toward $2,400–$2,410 and produced a lower price low than September 19. Yet CVD held near or marginally above its earlier negative 4.24 million trough. It then improved toward negative 4.08 million as prices rebounded. Although CVD remained negative, its recovery suggests waning selling aggression.
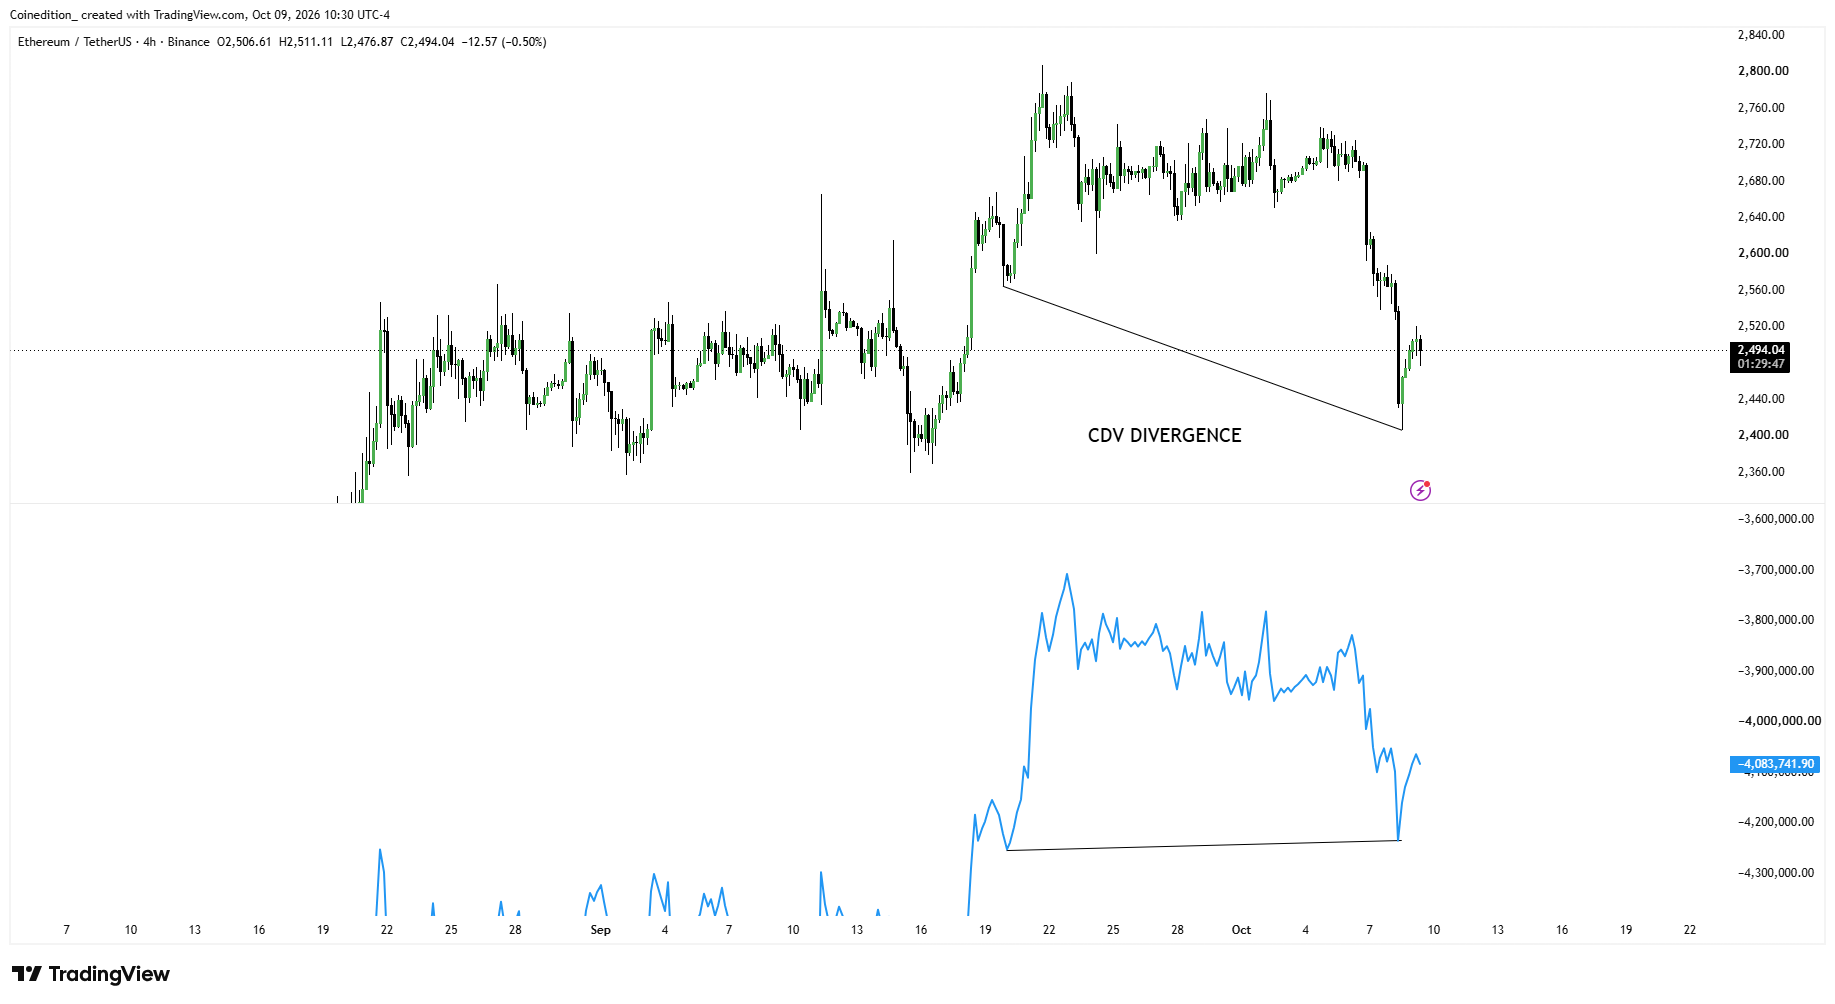
Passive buyers may have absorbed market selling near support, helping the ETH price stabilize. However, TradingView estimates CVD using lower-timeframe price and volume changes, not direct order-book executions. Therefore, neither confirmed passive bids nor a completed trend reversal can be inferred from the indicator alone.
Key Signals Favoring Ethereum’s Recovery
| Four-Hour Reading | Reported Observation |
| Price | $2,494.04 on October 9, after approaching $2,400 |
| Comparison | September 19 low versus October 8 lower price low |
| CVD | Near −4.24 million, later improving toward −4.08 million |
| Interpretation | Divergence favors waning selling pressure, not a confirmed reversal. |
Liquidations and ETF Outflows Complicate the Recovery
The support test was consistent with a sell-side liquidity sweep, as stop-loss orders and forced liquidations intensified selling pressure. However, the chart cannot distinguish these executions from fresh accumulation near support.
According to CoinGlass, Ether liquidations reached $140.05 million over 24 hours, exceeding Bitcoin’s $138.17 million. Meanwhile, total cryptocurrency liquidations climbed to $490.82 million, with bullish positions accounting for more than $322 million.
Beyond the liquidation pressure, institutional flows also weighed on market sentiment. Farside Investors recorded $72.5 million in U.S. spot Ether ETF net outflows on October 8. Of that amount, BlackRock’s ETHA accounted for $71.1 million, bringing cumulative October outflows to $578.9 million through that session.
Additionally, macroeconomic conditions remained restrictive, adding another challenge to the recovery. The Federal Reserve raised interest rates by 25 basis points in September, bringing its benchmark range to 3.75%–4.00%. Meanwhile, the U.S. 10-year Treasury yield hovered near 5.29% on October 9, potentially limiting investor appetite for risk-sensitive assets.
ETH Must Reclaim $2,500–$2,800 Resistance Before Targeting $2,807.65
Despite these broader market pressures, ETH’s price rebound and improving CVD indicate developing bullish initiation rather than established buyer control. For that pressure to translate into stronger momentum, Ethereum’s price must reclaim the former breakdown zones. Higher four-hour lows, sustained closes above resistance, and continued CVD improvement would strengthen confirmation.
Levels that Decide ETH’s Next Move
| Price Zone | Technical Role |
| $2,500–$2,520 | Immediate resistance and first recovery test |
| $2,560–$2,600 | Broken support requiring a reclaim |
| $2,680–$2,730 | Consolidation zone before the selloff |
| $2,760–$2,800 | Late-September and early-October highs; potential buy-side liquidity |
| $2,807.65 | Proposed upside liquidity objective, not a CVD-derived forecast |
| $2,400–$2,410 / $2,360 | Support failure threshold and next downside reference. |
EXPANSION CASE
Reclaiming successive resistance zones would expose the prior highs and the $2,807.65 objective, approximately 12.6% above $2,494.04.
FAILURE CASE
Renewed selling below $2,400–$2,410 alongside weaker CVD would challenge absorption and refocus $2,360.
BOTTOM LINE
The liquidity sweep, divergent CVD, and rebound support an early bullish setup. Yet, buyers still need four-hour confirmation before the projected advance.
FAQs
The divergence is bullish because Ethereum formed a lower price low while CVD did not, indicating that selling pressure was weakening despite the decline.
The $2,400 level marked a potential sell-side liquidity sweep, as prices approached support before recovering alongside improving CVD readings.
Although the rebound suggests buyers absorbed selling pressure near support, passive absorption remains unconfirmed as the chart lacks direct order-book execution data.
A sustained recovery above overhead resistance, accompanied by improving CVD and higher price lows, would strengthen the bullish case toward $2,807.65.
Conversely, a sustained break below $2,400–$2,410, accompanied by deteriorating CVD, would weaken the recovery outlook and expose the $2,360 support level.
Related: Bitcoin Price LIVE: Buyers Absorb Selling as $87,220 Liquidity Target Looms
Disclaimer: The information presented in this article is for informational and educational purposes only. The article does not constitute financial advice or advice of any kind. Coin Edition is not responsible for any losses incurred as a result of the utilization of content, products, or services mentioned. Readers are advised to exercise caution before taking any action related to the company.