

- Arthur Hayes bought another 1,332.5 ETH worth $2.53M, bringing his total accumulation since July 16 above 2,600 ETH
- ETH’s staking ratio hit a record 33.9%, locking roughly one-third of total supply away from open market selling
- Nearly 1M ETH worth $2B left exchanges over the past month, reducing available sell-side supply per Ali Charts
Ethereum trades at $1,916.26 on July 22, down 0.66%, pressing against the 0.5 Fibonacci level at $1,939.99 after Arthur Hayes added another 1,332.5 ETH to a position he started building on July 16. The staking ratio hit an all-time high of 33.9% the same week, tightening the available float as exchange balances fall at their fastest pace in months.
ETH Price Today: Battling the 0.5 Fibonacci and 100-Day EMA at the Same Level
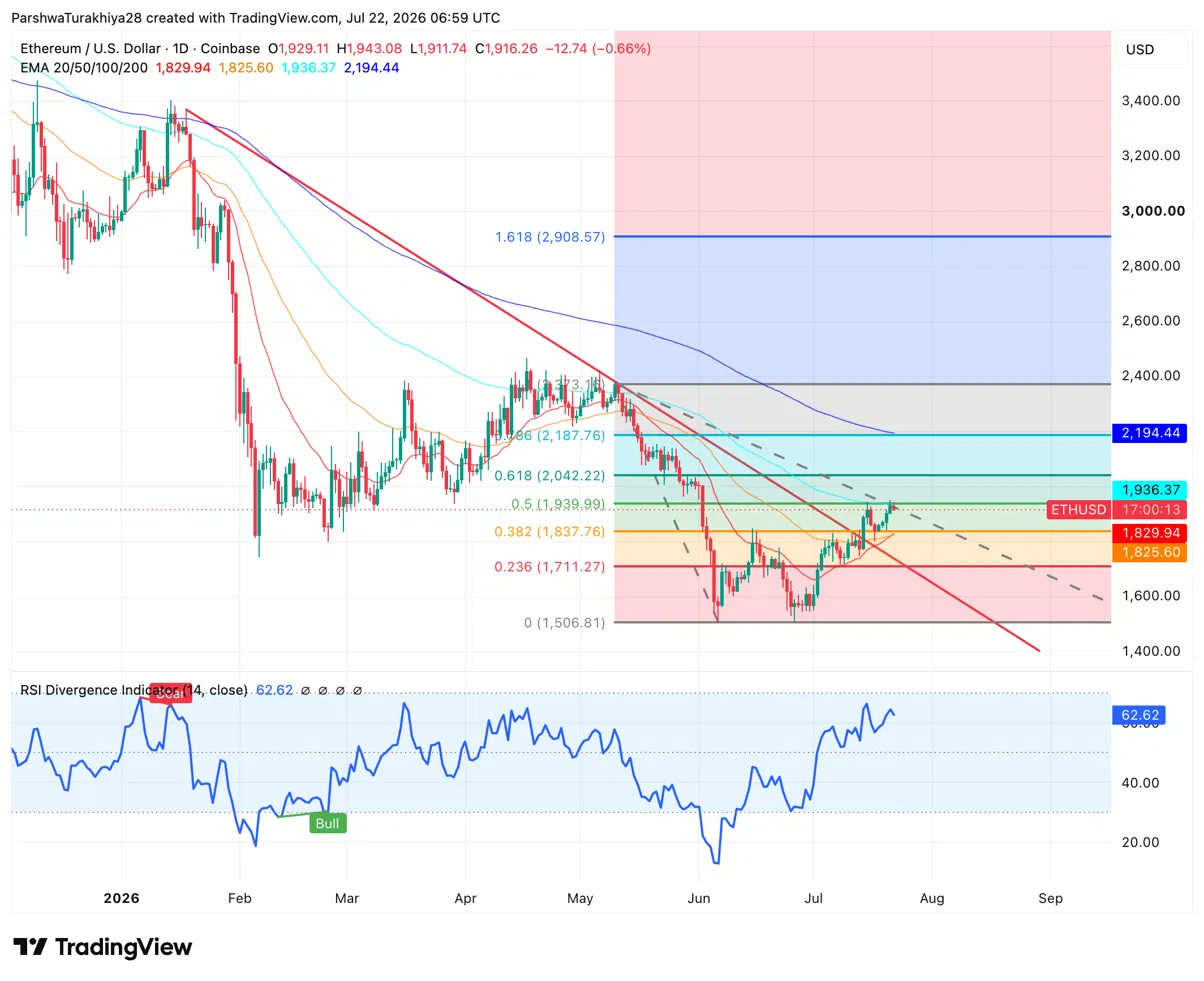
The daily chart shows ETH pressing against the 0.5 Fibonacci level at $1,939.99, which aligns almost exactly with the 100-day EMA at $1,936.37, creating a tight resistance cluster that price has tested multiple times without a clean close above. The RSI Divergence Indicator at 62.62 is trending upward and sits just below the January bearish divergence that correctly called the February collapse, which means momentum is building without yet reaching the level where it becomes a warning sign.
Related: Ondo Price Prediction: Can Buyers Push Beyond $0.4107 for the Next Rally?
Below price, the 20-day EMA at $1,829.94 and 50-day at $1,825.60 have converged into a single support band. The 0.382 Fibonacci at $1,837.76 sits in that same zone, making the $1,825 to $1,838 area the key floor to hold. Above the current resistance, the 0.618 Fibonacci at $2,042.22 is the next target, followed by the 0.786 at $2,187.76 and the 200-day EMA at $2,194.44. The 1.618 extension at $2,908.57 remains the bull case target if the recovery extends into a full trend reversal.
What Are The Key Support And Resistance Levels For ETH Today?
- Support at $1,829.94 on the 20-day EMA and $1,825.60 on the 50-day
- Resistance at $1,936.37 on the 100-day EMA and $1,939.99 on the 0.5 Fibonacci
- Extended resistance at $2,042.22 on the 0.618 and $2,187.76 on the 0.786 Fibonacci
- Key floor at $1,506.81 at the Fibonacci zero point and June low
- Bull case target at $2,908.57 on the 1.618 Fibonacci extension
Arthur Hayes Has Now Accumulated Over 2,600 ETH In Less Than A Week
Arthur Hayes added 1,332.5 ETH worth $2.53M on July 22, per Lookonchain, following the 1,293 ETH he purchased on July 16. His combined recent accumulation now sits above 2,600 ETH at an average entry around $1,900.
Hayes sold 6,000 ETH at a loss in late June before reversing course, making this a deliberate re-entry rather than a continuation of a prior position. At the scale he is operating, OTC transactions through Galaxy Digital and FalconX rather than open market buys, the accumulation avoids moving price directly but signals conviction at a level that the market tends to notice.
Three Supply Metrics Are All Pointing The Same Direction
ETH’s staking ratio reached 33.9% of total supply, the highest level in the network’s history, per analyst Lucky. One-third of all ETH is now locked validating the network rather than sitting available to sell. This is a structural tightening of float that operates regardless of demand conditions.
Separately, Ali Martinez flagged that nearly one million ETH worth approximately $2 billion has been withdrawn from exchanges over the past month. Falling exchange balances reduce immediately available sell-side supply without requiring new buyers, which supports price at current levels even when demand is not accelerating.
The combination creates a situation where all three primary supply metrics — staking ratio, exchange balances, and effective float — are tightening simultaneously. That is a less common setup than individual metrics moving in isolation and amplifies the potential price impact of any new demand entering the market.
ETH Derivatives: Consolidation, Not New Positioning
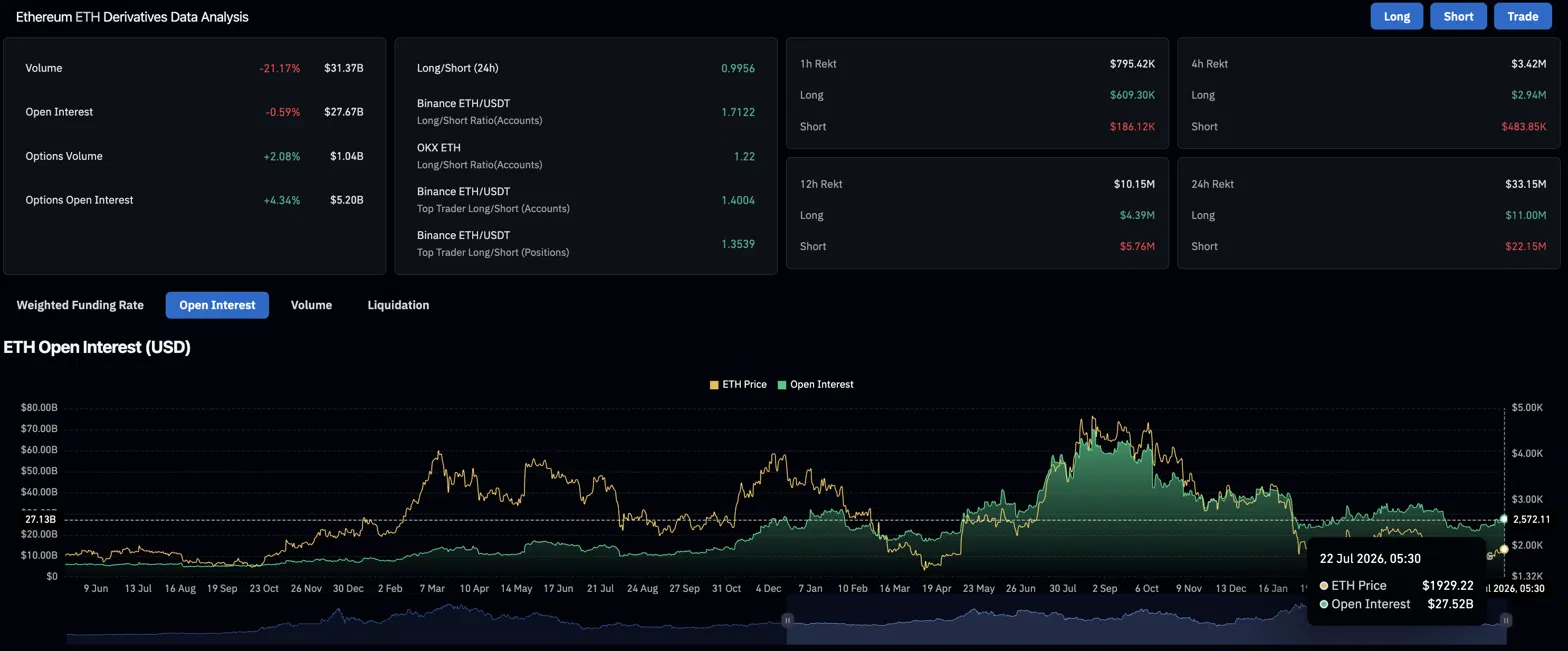
Volume falling 21.17% on a session where price moved less than 1% is the characteristic signature of consolidation rather than distribution. The market is waiting rather than selling. Options OI rising 4.34% while spot volume falls confirms institutional accounts are using options to hedge the resistance test rather than reducing exposure outright.
| Metric | Value | Signal |
| 24h Volume | $31.37B (-21.17%) | Declining volume on flat price — consolidation, not selling pressure |
| Open Interest | $27.67B (-0.59%) | Nearly flat — no large new directional positions being opened |
| Options Volume | $1.04B (+2.08%) | Slight rise — traders hedging around resistance, not committing |
| Options Open Interest | $5.20B (+4.34%) | Growing options exposure — institutional hedging at scale |
| Short Liquidations (24h) | $22.15M | Short squeeze dynamic intact even on a down day |
| Long Liquidations (24h) | $11.00M | 2:1 ratio favoring short squeeze over long flush |
| Top Trader L/S (Accounts) | 1.40 | Large accounts net long |
| Top Trader L/S (Positions) | 1.35 | Position sizing also net long |
Ethereum Price Prediction: Upside and Downside Targets
- Upside case: ETH closes above the 100-day EMA at $1,936.37 and the 0.5 Fibonacci at $1,939.99, Hayes accumulation and the record staking ratio attract fresh institutional buying, and price targets the 0.618 Fibonacci at $2,042.22 as the CLARITY Act catalyst drives broader crypto momentum.
- Downside case: The 100-day EMA and 0.5 Fibonacci continue to reject price, ETH slips back toward the 20 and 50-day EMA cluster at $1,825 to $1,830, and the consolidation extends through the FOMC meeting on July 29 before a directional resolution arrives.
Related: Stellar (XLM) Price Prediction 2026, 2027, 2028, 2029, 2030 -2050
Disclaimer: The information presented in this article is for informational and educational purposes only. The article does not constitute financial advice or advice of any kind. Coin Edition is not responsible for any losses incurred as a result of the utilization of content, products, or services mentioned. Readers are advised to exercise caution before taking any action related to the company.