

- Ethereum price prediction stays bullish above $2,481.31, the level Supertrend flipped to support on the 4-hour chart
- Short sellers absorbed $34.21 million of the past 24 hours’ $46.34 million in ETH liquidations
- ETH’s exchange supply ratio has fallen toward its lowest levels since 2024 even as price climbs, according to CryptoQuant
Ethereum price prediction for September 19 stays bullish above $2,481.31, the Supertrend support level that held through a short squeeze as ETH bounced off its SAR floor near $2,359.
Ethereum Price Analysis: Can ETH Hold the Supertrend Flip at $2,481?
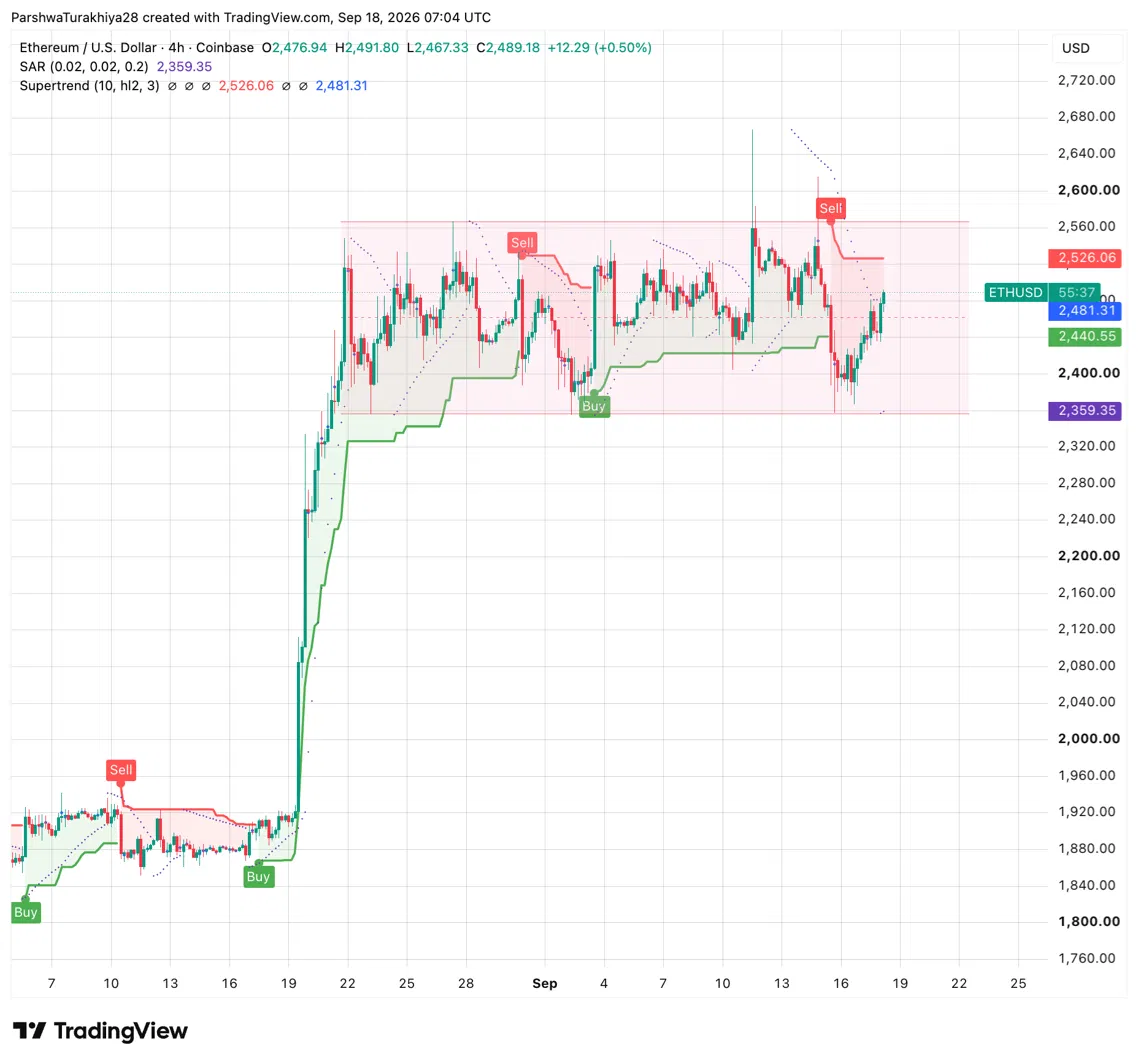
Yes, for now. ETH trades near $2,489.18, up 2% over the past 24 hours after bouncing off the Parabolic SAR at $2,359.35 following a sharp pullback from above $2,600 earlier this week. Two Supertrend readings sit on the chart, a slower one still bearish at $2,526.06, and a faster one that’s already flipped bullish at $2,481.31, the level price is now holding above.
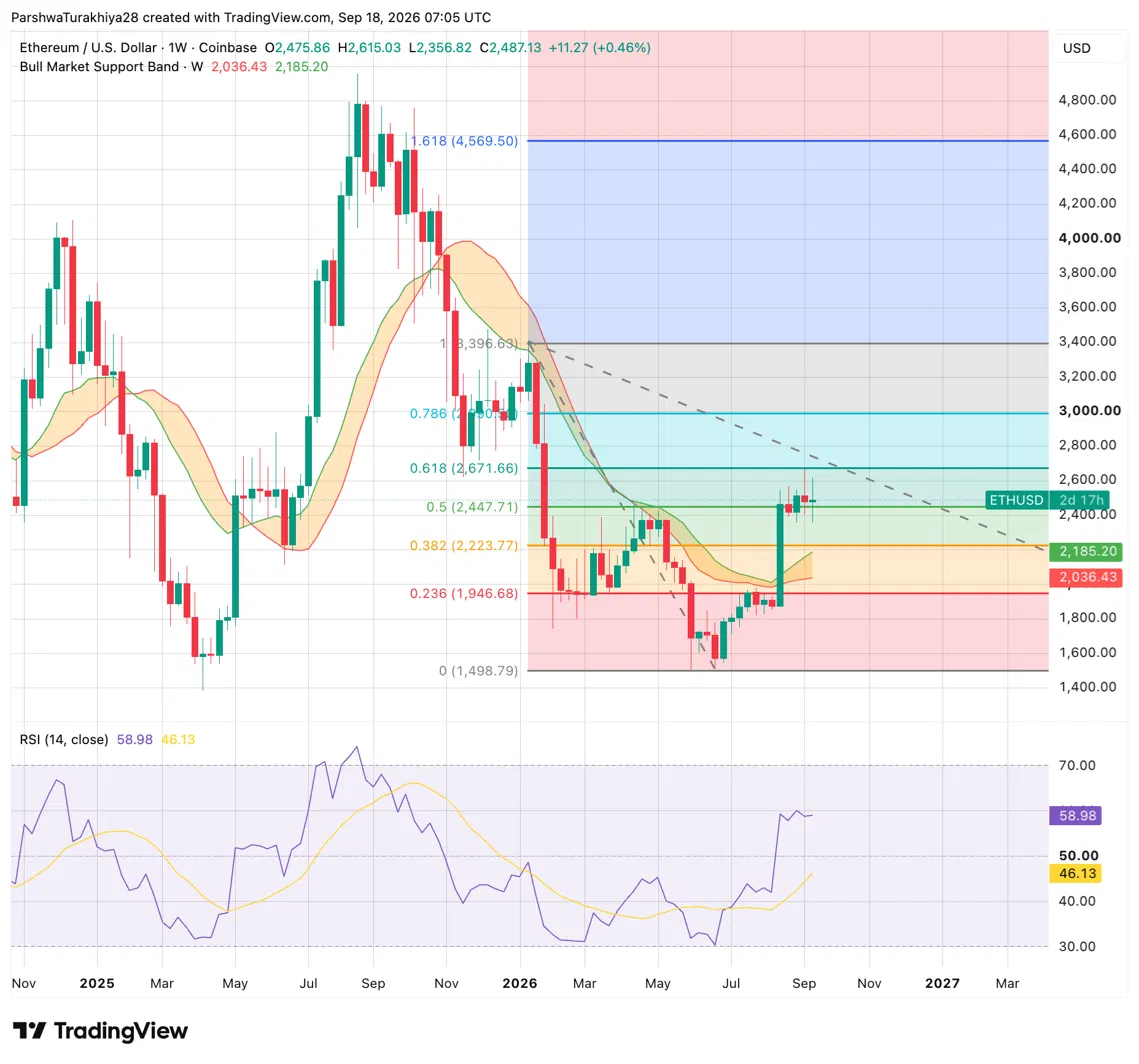
The weekly chart backs up the bigger trend. ETH closed the week near $2,487.13, just above the 0.5 Fib retracement at $2,447.71, with the 0.618 Fib at $2,671.66 the next resistance. The weekly Bull Market Support Band at $2,036 to $2,185 sits well below price, and weekly RSI at 58.98 still has room to run before overbought territory.
Related: Cardano Price Prediction: Can ADA Hold Its Breakout as On-Chain Activity Slides 72%?
ETH Support and Resistance Levels
| Type | Price |
| Resistance | $2,526.06 |
| Resistance | $2,615.03 |
| Resistance | $2,671.66 |
| Support | $2,481.31 |
| Support | $2,447.71 |
| Support | $2,359.35 |
Ethereum News: Exchange Supply Falls Toward Multi-Year Lows as Price Climbs
Ethereum’s exchange supply ratio, the share of circulating ETH sitting on exchanges, has fallen toward its lowest levels since CryptoQuant began tracking it in 2024, even as price recovers. The ratio peaked near 0.18 in mid-2024 and has declined steadily since, dropping to roughly 0.125 by mid-2026. Trader Crypto Rover flagged the divergence on X, asking whether a supply shock is building.
Related: Dash Price Prediction: Can DASH Clear $70 as Its Weekly Chart Turns Bullish?
A falling ratio generally means fewer coins sit on exchanges ready to sell, since holders are moving ETH into staking or cold storage instead. This is a different metric from the ETF flows below, one tracks coins on exchanges, the other tracks money moving through regulated funds, and the two can move in opposite directions in the same week.
Ethereum Derivatives: Shorts Take the Bulk of Every Liquidation Window
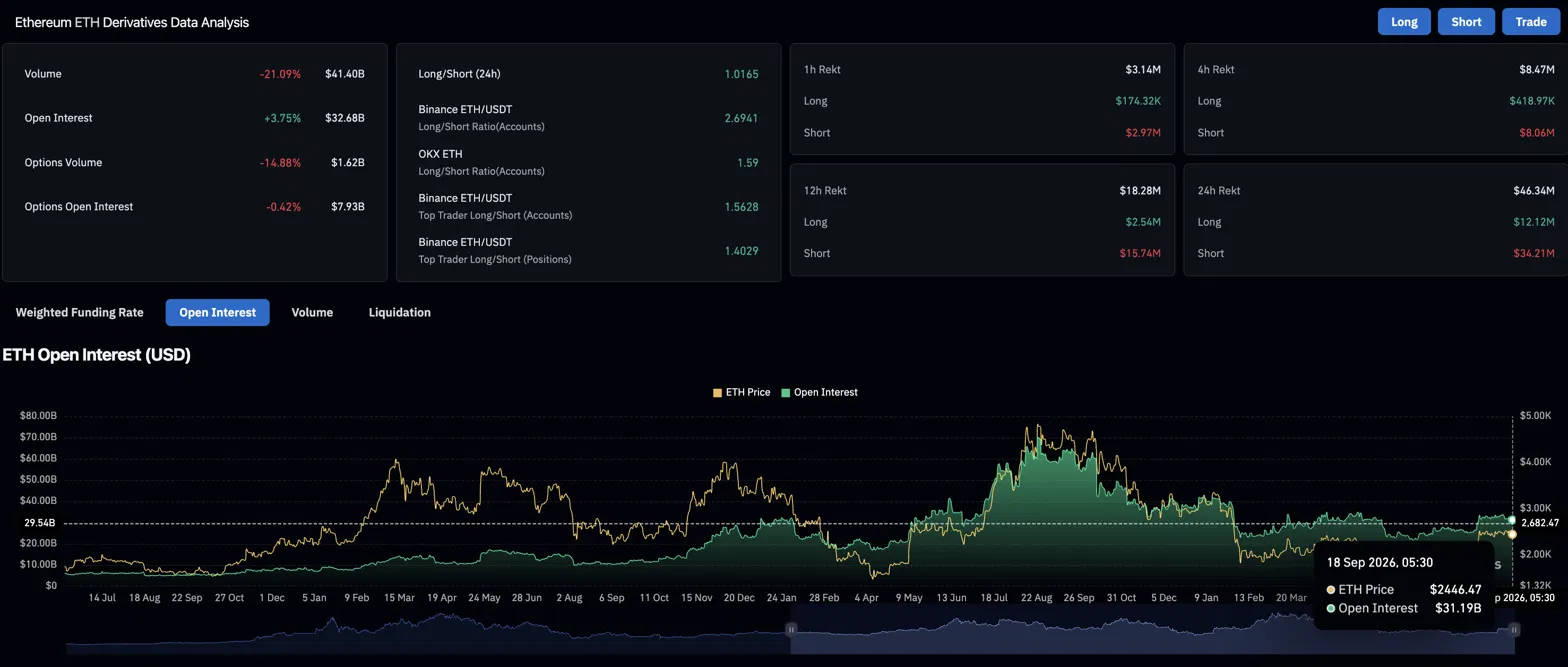
ETH derivatives volume fell 21.09% to $41.40 billion over the past 24 hours, while open interest rose 3.75% to $32.68 billion, traders holding onto positions even as overall trading slowed down.
Liquidations were one-sided across every timeframe. Shorts took $34.21 million of the past 24 hours’ $46.34 million total, and that same pattern held over the last hour, four hours, and 12 hours too. Traders keep leaning long, Binance’s account ratio sits at 2.6941.
| Metric | Value | What it shows |
| Derivatives volume (24h) | $41.40B, down 21.09% | Trading activity cooled |
| Open interest | $32.68B, up 3.75% | Traders held positions despite less trading |
| 24h short liquidations | $34.21M of $46.34M total | Shorts took the bulk of the squeeze |
| Binance long/short ratio | 2.6941 | Traders leaning long |
Ethereum ETF Flows: A Third Straight Outflow Day After Mid-Month Inflows
US spot ETH ETFs posted a $39.24 million net outflow on September 17, a third straight outflow day:
- Sep 17: -$39.24M
- Sep 16: -$224.11M
- Sep 15: -$141.47M
That reverses a run of inflows earlier in the month, including $216.41 million on September 11 and $121.02 million on September 14. Cumulative net inflows stand at $13.11 billion, with total net assets at $15.42 billion.
Related: Uniswap Price Prediction: UNI Climbs 37% Weekly as SEC Opens Door to Tokenized Stocks
BlackRock’s ETHA led Thursday’s outflow at $42.86 million, while Fidelity’s FETH was the only fund to see an inflow, adding $1.83 million. ETHA remains the largest fund by net assets at $8.60 billion despite the outflow, and Grayscale’s legacy ETHE, which has bled a cumulative $5.43 billion since converting from a trust, holds $1.77 billion in net assets.
Ethereum Price Prediction: Bullish and Bearish Scenarios
Bullish Case, Target: $2,671.66 (0.618 Fib)
ETH holds above $2,481.31 and clears the slower Supertrend’s bearish level near $2,526.06. Continued short covering and a falling exchange supply ratio could support a push back toward the spike high near $2,615.03 and the 0.618 Fib at $2,671.66.
Bearish Case, Risk Level: $2,359.35 (SAR)
ETH loses $2,481.31 and slips back toward the SAR floor at $2,359.35. A resumption of ETF outflows or a fading short squeeze would fit that scenario, exposing the 0.5 Fib support at $2,447.71 first and the weekly Bull Market Support Band near $2,036 to $2,185 further below.
FAQs
ETH could extend toward $2,615.03 and then the 0.618 Fib at $2,671.66 if it holds above $2,481.31. Losing that level risks a slide toward the SAR floor at $2,359.35.
ETH bounced sharply off a low near $2,359.35 after an earlier pullback from above $2,600, and that recovery caught leveraged short positions off guard, with shorts absorbing the bulk of liquidations across every timeframe from one hour to 24 hours.
Yes. Ethereum’s exchange supply ratio has dropped toward its lowest levels since 2024, according to CryptoQuant data, even as ETH’s price has climbed, a divergence traders are flagging as a potential supply shock setup.
Not currently. US spot ETH ETFs have posted three straight days of outflows through September 17, reversing gains from earlier in the month, though cumulative inflows remain positive at $13.11 billion.
Disclaimer: The information presented in this article is for informational and educational purposes only. The article does not constitute financial advice or advice of any kind. Coin Edition is not responsible for any losses incurred as a result of the utilization of content, products, or services mentioned. Readers are advised to exercise caution before taking any action related to the company.