


- ETH trades at $1,678 after a 68% drop from its $4,953 August 2025 peak
- Spot ETF inflows returned with $82.37M on June 8, first green day after six sessions of outflows
- MVRV below 0.8 flags a historically rare accumulation zone tied to previous cycle bottoms
Ethereum trades at $1,678 on June 9, recovering from a low of $1,593 after slicing through the weekly 200 MA and the Bull Market Support Band without a single meaningful bounce attempt. Spot ETF inflows came back with $82.37M on June 8, landing on the exact same day the chart printed a bullish reversal candle.
What the ETH Daily Chart Shows After a 68% Crash
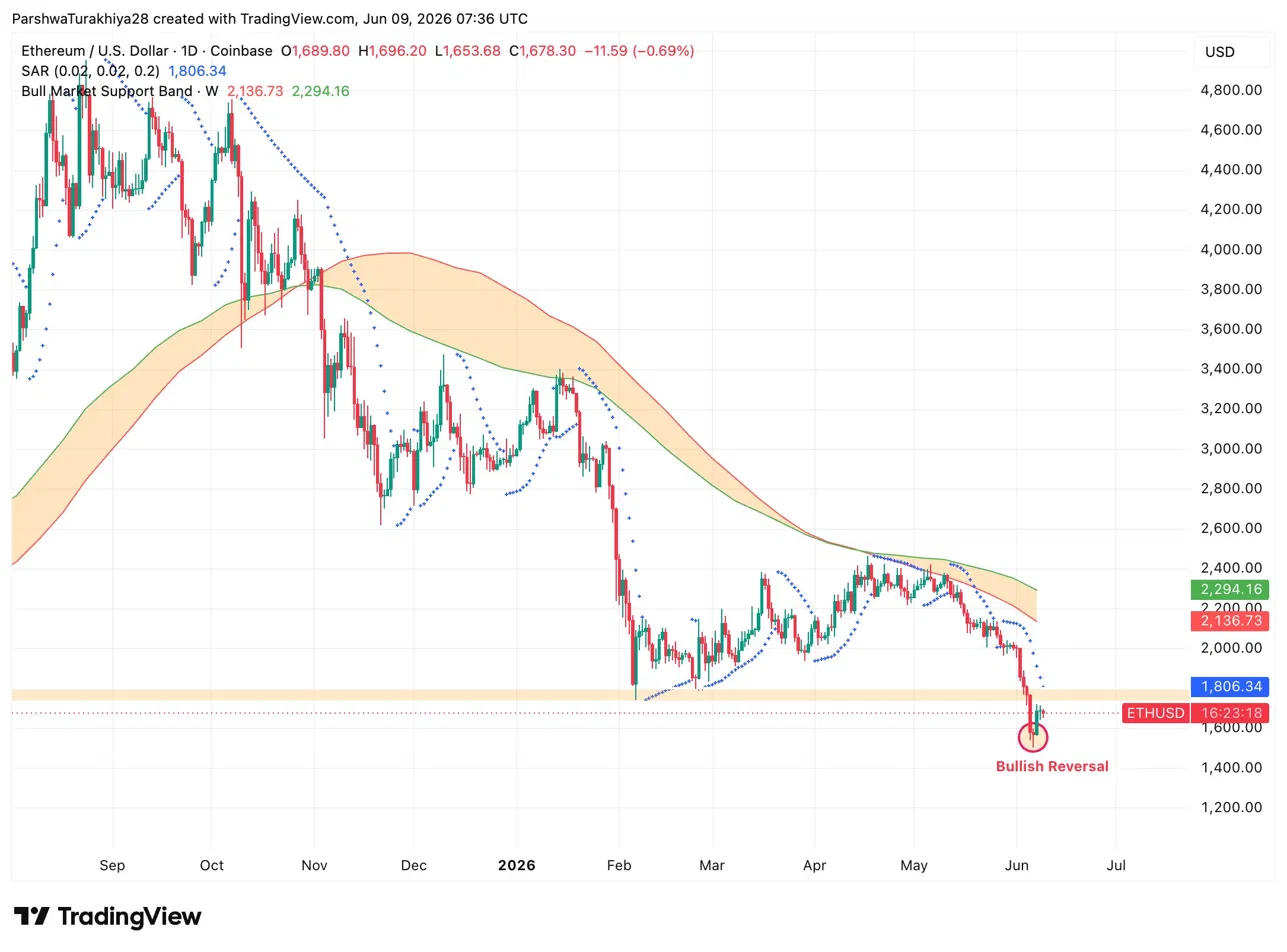
ETH has dropped 68% from its $4,953 August 2025 peak and broken cleanly below the Bull Market Support Band sitting between $2,136 and $2,294. The Parabolic SAR at $1,806 now sits overhead as resistance, confirming the daily trend has not reversed yet.
Related: Worldcoin (WLD) Price Prediction 2026, 2027, 2028, 2029, 2030-2050
The one signal bulls are holding onto is the reversal candle printed at $1,593. Price bounced sharply from that level and is now attempting to stabilize near $1,678. The SAR is still bearish, so reclaiming $1,806 is the first real test of whether this bounce has legs.
- Resistance: $1,806 (SAR), $2,136 (Bull Market Support Band lower)
- Support: $1,593 (recent low), $1,500 (next key level)
Ethereum Spot ETF Inflows Return Right at the Low
ETH spot ETFs pulled in $82.37M on June 8, the strongest single-day inflow in weeks. It followed a brutal stretch where outflows dominated almost every session: June 5 saw -$4.83M, June 3 -$52.94M, June 2 -$90.15M, and June 1 -$44.44M. June 4 was the only exception with $19.30M in inflows before selling resumed.
Fidelity led June 8 with $28.57M, BlackRock’s two products added a combined $44.72M, and Grayscale’s ETH fund brought in $8M. VanEck was the lone negative at -$3.70M.
ETH Derivatives Show a Market Caught Between Two Sides
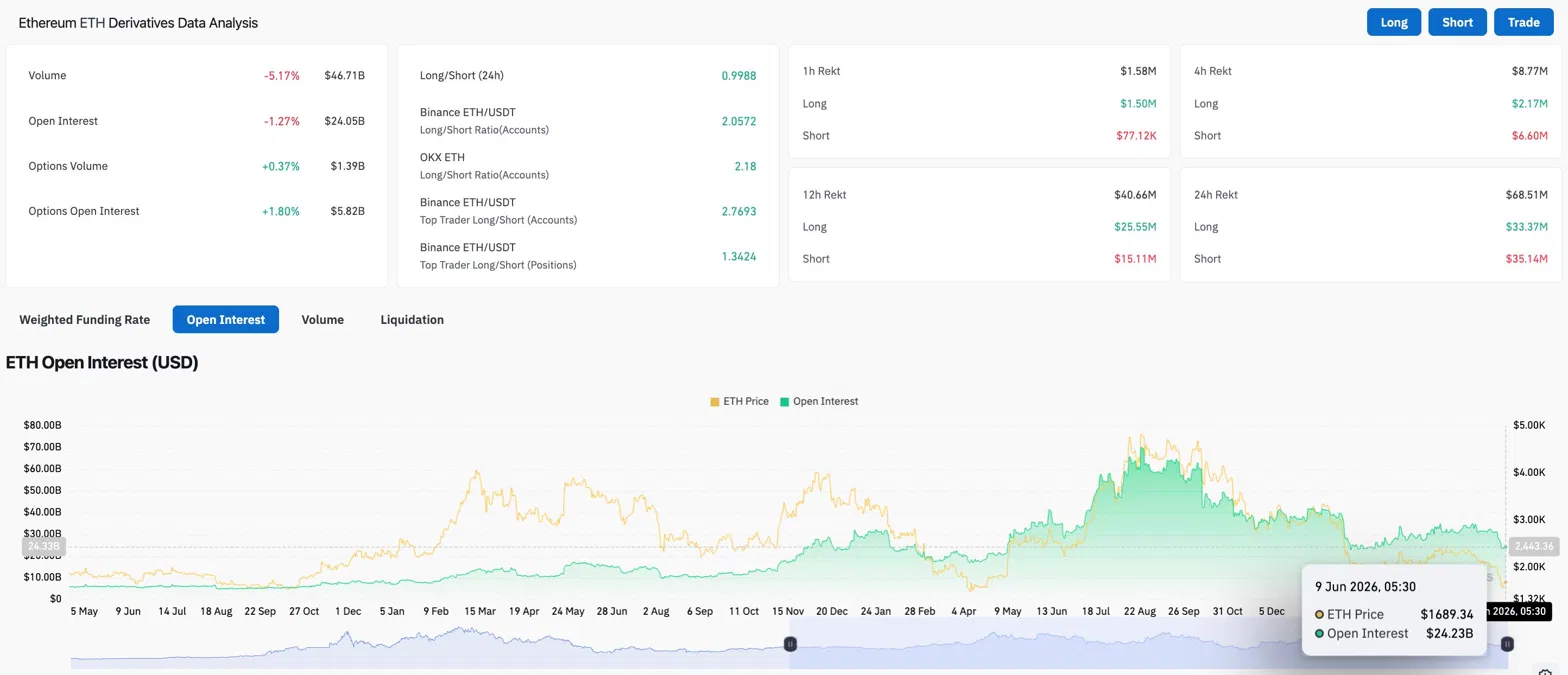
Volume fell 5.17% to $46.71B while open interest dropped 1.27% to $24.05B. Both declining together points to position closures, not new bets being placed. The 24-hour long/short ratio sits at 0.9988, essentially neutral.
Over 24 hours, $33.37M in longs were liquidated against $35.14M in shorts. The market is squeezing both sides simultaneously, which typically happens at inflection points before a decisive move.
Why Analysts Think $1,500 Is the Most Important Level Right Now
Analyst Ash Crypto notes ETH has played out this exact pattern only once before. In June 2022, ETH crashed through every support and bottomed at $880, which turned out to be the bear market floor. Buyers at that level saw a 5x return over the following 18 months. The line in the sand now is $1,500. A weekly close below it removes that historical parallel entirely and opens a path toward $1,000 with no major support between.
On-chain analyst Ali Charts flags ETH below the 0.8 MVRV Pricing Band as a high-probability long-term accumulation zone, a reading historically tied to generational buying opportunities in prior cycles.
Ethereum Price Prediction for June 10, 2026
- Upside: A hold above $1,593 and a reclaim of $1,806 targets $2,136. Sustained ETF inflows above $50M daily and MVRV data together build the case for a gradual recovery toward $2,000.
- Downside: A weekly close below $1,500 breaks the June 2022 parallel and opens the door to $1,000, with no technical floor of significance in between.
Related: Velvet Price Prediction: After a 240% Rally, Can VELVET Break Above $0.39?
Disclaimer: The information presented in this article is for informational and educational purposes only. The article does not constitute financial advice or advice of any kind. Coin Edition is not responsible for any losses incurred as a result of the utilization of content, products, or services mentioned. Readers are advised to exercise caution before taking any action related to the company.


 Price Prediction 2026, 2027, 2028, 2029, 2030-2050")

