



- Ethereum trades below all major EMAs as bearish momentum threatens support at $2,059.40.
- ETH open interest fell to $28.18 billion as declining leverage signals weaker trader demand.
- Buterin questions fee burning as Ethereum prioritizes network utility, decentralization, and security.
Ethereum faces mounting pressure as weakening market indicators coincide with renewed debate over the network’s long-term economic model. ETH trades around $2,128.86 after failing to sustain its recovery toward $2,450. Meanwhile, declining derivatives activity and persistent spot market outflows suggest investors remain cautious.
Ethereum’s Technical Structure Remains Bearish
Ethereum’s daily chart continues displaying a bearish structure after breaking below the $2,236.54 Fibonacci retracement level. This breakdown indicates that sellers maintain control despite previous recovery attempts.
Additionally, ETH trades below all four major exponential moving averages. The 20-day EMA stands at $2,291.12, while the 50-day EMA sits at $2,371.16. Meanwhile, the 100-day and 200-day EMAs stand at $2,337.39 and $2,311.19, respectively.
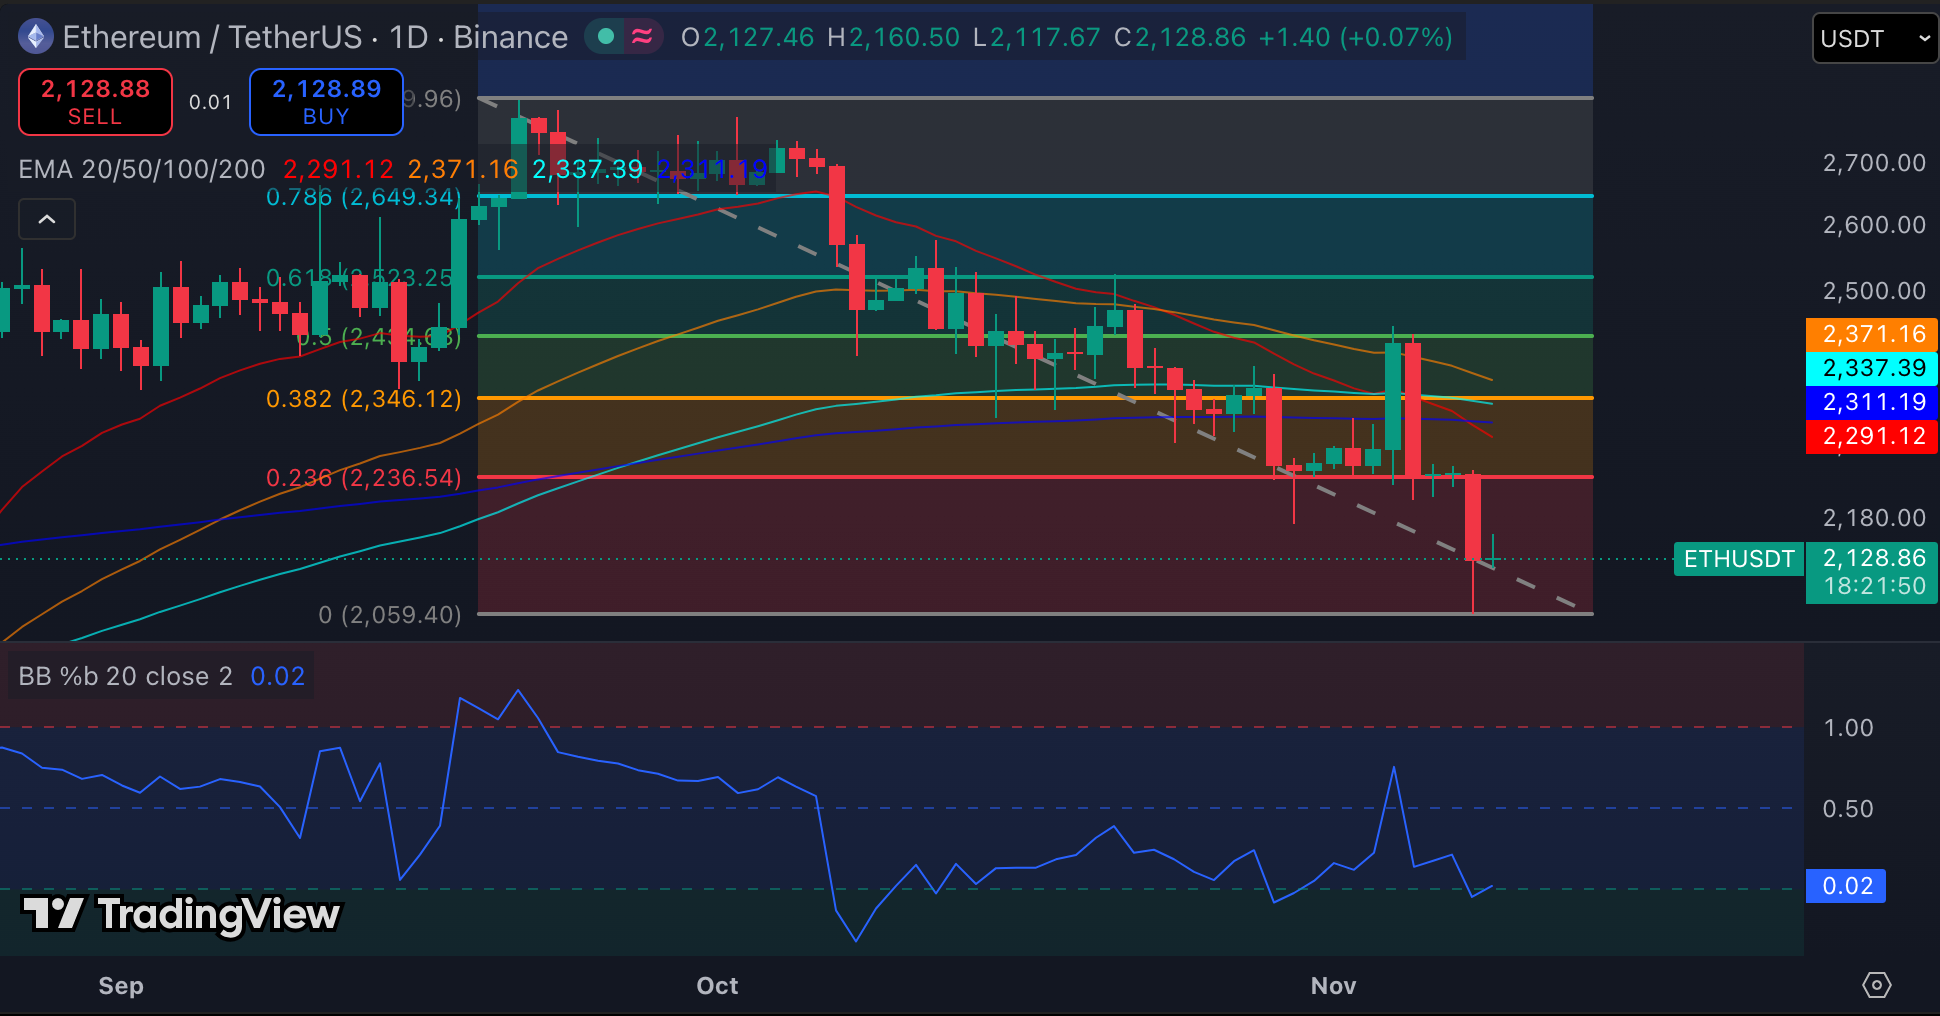
The descending trendline reinforces this negative structure. Besides, the Bollinger Bands %B indicator has fallen to 0.02. This reading places ETH near its lower Bollinger Band and reflects substantial selling pressure.
However, the oversold position could encourage a temporary recovery if buyers defend nearby support. Ethereum currently faces immediate support around $2,117.67. A breakdown could expose the next support at $2,059.40.
Consequently, a sustained move below $2,059.40 would increase the risk of additional losses. Conversely, reclaiming $2,236.54 would provide the first indication of improving momentum. A stronger recovery above $2,291.12 could support a broader bullish reversal.
Ethereum Derivatives and Spot Flows Signal Weak Demand
Ethereum’s derivatives market reflects declining speculative interest as traders reduce leveraged positions. Open interest has retreated considerably from its August peak of approximately $65 billion.
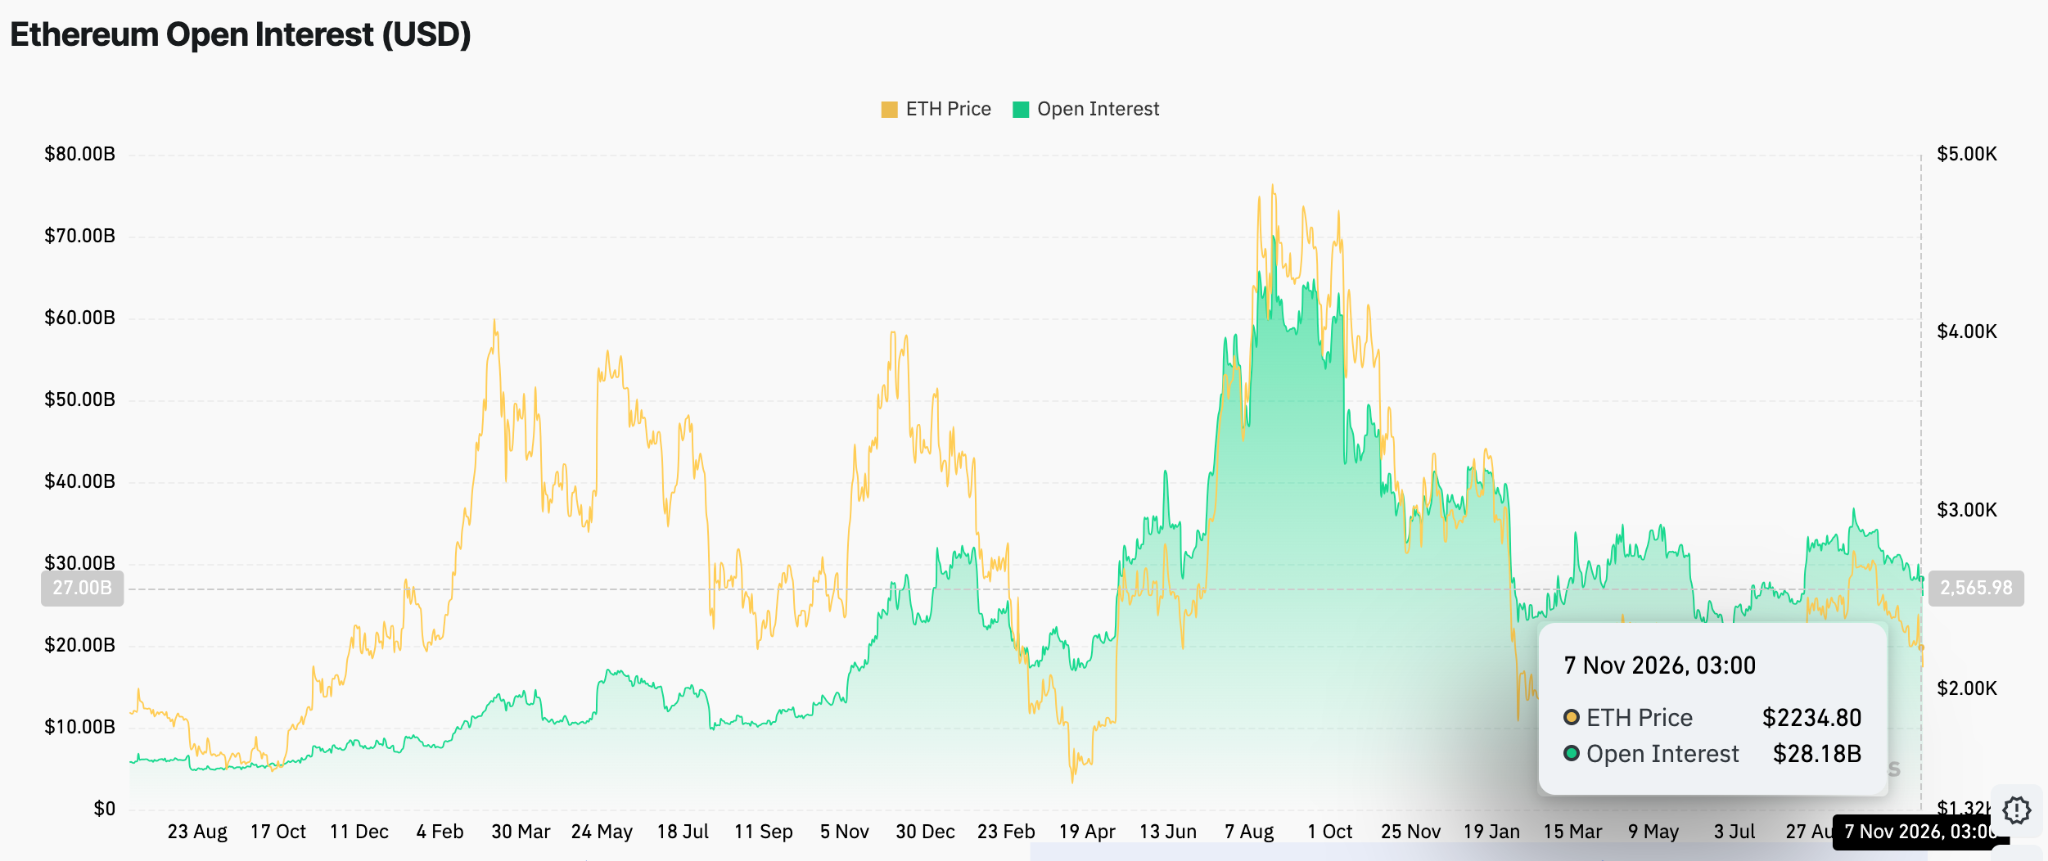
Although the metric briefly exceeded $30 billion in late August, it subsequently reversed. The latest reading reached $28.18 billion on November 7, down from recent highs near $36 billion.
This contraction suggests traders have reduced exposure amid weakening market conditions. Moreover, declining open interest alongside falling prices indicates limited appetite for additional bullish positions.
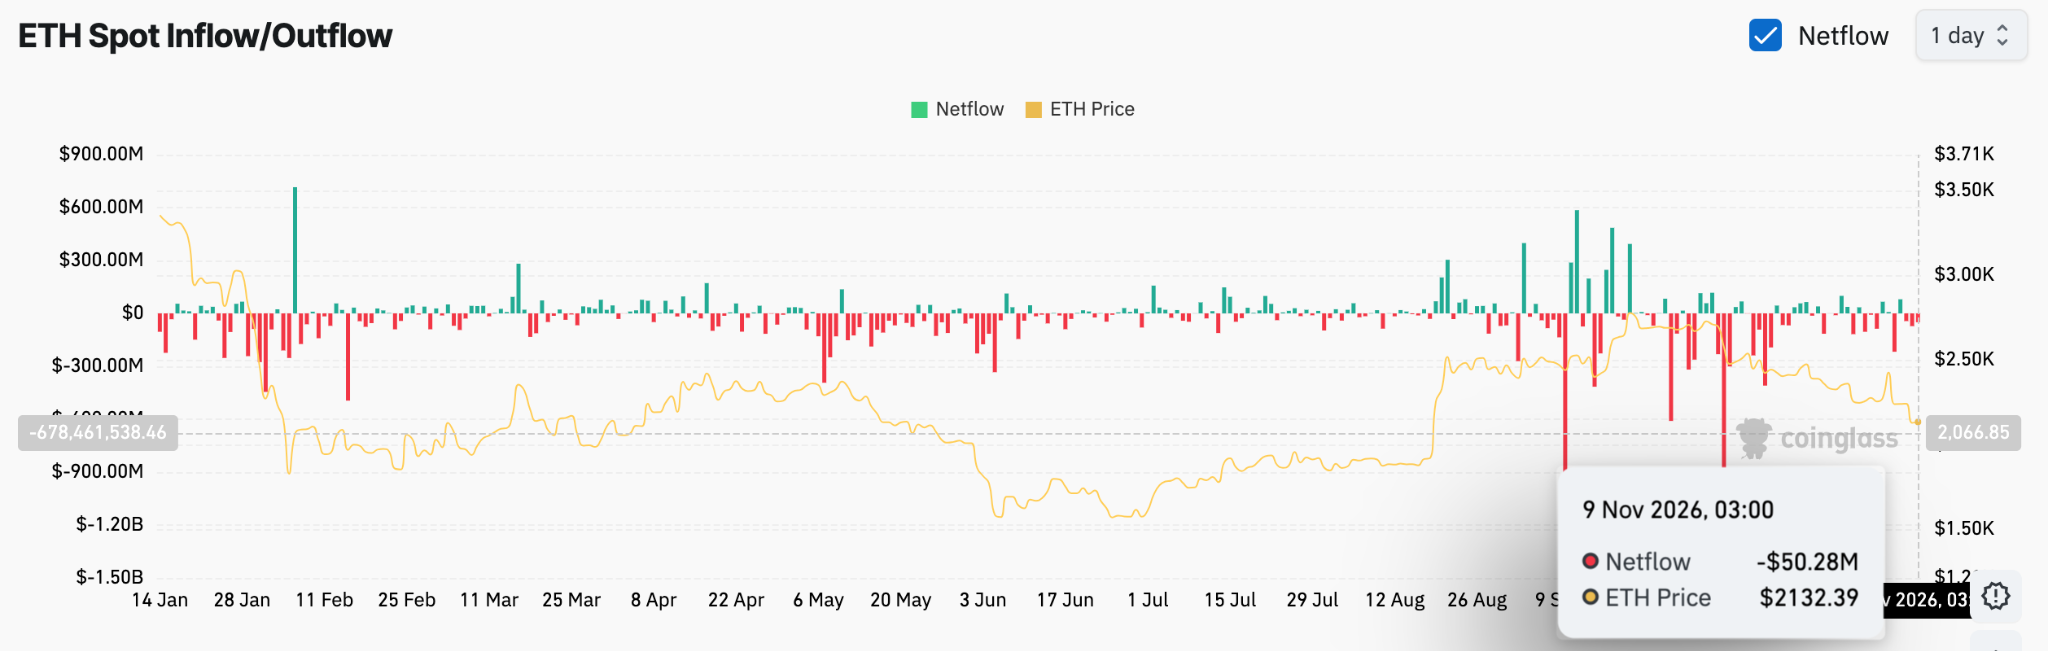
Spot market activity presents another challenge for Ethereum. Although occasional inflow spikes appeared during February, March, and late August, negative netflows repeatedly dominated.
Significantly, large withdrawal spikes emerged between September and October. The November 9 reading showed negative netflows of $50.28 million. This development reinforces concerns about weakening demand and persistent selling pressure.
Vitalik Buterin Challenges Ethereum’s Fee-Burning Narrative
Ethereum’s market weakness coincides with Buterin’s reassessment of the network’s economic priorities. He argues that transaction fee burning should not determine ETH’s long-term value.
The co-founder maintains that EIP-1559 remains an important network improvement. However, he questions whether burning fees can independently support Ethereum’s valuation.
Buterin’s argument shifts attention toward the relationship between network utility and token demand. He believes Ethereum needs stronger foundations beyond reducing its circulating supply.
Additionally, he highlights decentralization, censorship resistance, open-source development, privacy, and security. These characteristics could strengthen Ethereum’s position as a reliable settlement network.
He also emphasizes the importance of long-term network survival. This objective connects with Ethereum’s quantum-resistant roadmap and efforts toward greater protocol stability.
Furthermore, increasing asset issuance on Ethereum’s mainnet could expand ETH’s utility. However, achieving this objective requires infrastructure that attracts users without making network participation prohibitively expensive.
Technical Outlook for Ethereum Price
Key levels remain critical as Ethereum struggles to recover from its recent decline:
- Upside levels: $2,236.54, $2,291.12, and $2,311.19 represent immediate resistance. A breakout could extend toward $2,337.39, $2,371.16, and $2,449.
- Downside levels: $2,117.67 provides immediate support, followed by $2,059.40. A decisive breakdown could expose ETH to lower support zones.
- Resistance ceiling: $2,236.54 (0.236 Fibonacci retracement) is the first major level bulls must reclaim. The 20-day EMA at $2,291.12 represents the next hurdle for recovery.
Ethereum’s technical structure remains bearish, with the price trading below all four major EMAs. The Bollinger Bands %B reading of 0.02 indicates strong downside pressure, although oversold conditions could encourage a relief bounce.
Outlook: Will Ethereum Price Recover?
Ethereum’s price prediction hinges on whether buyers can defend $2,059.40 and reclaim the $2,236.54 resistance level. Declining open interest and negative spot netflows indicate weak market participation and persistent selling pressure.
If buying momentum strengthens, ETH could challenge $2,291.12 and $2,371.16. A sustained breakout above these levels could open the way toward $2,449.
However, failure to maintain support at $2,059.40 could accelerate losses. For now, Ethereum remains in a vulnerable position as technical weakness and declining derivatives activity weigh on recovery prospects.
Disclaimer: The information presented in this article is for informational and educational purposes only. The article does not constitute financial advice or advice of any kind. Coin Edition is not responsible for any losses incurred as a result of the utilization of content, products, or services mentioned. Readers are advised to exercise caution before taking any action related to the company.