


- ETH trades at $2,053 as BTC dominance drops to 58.61%, continuing a downtrend from the July peak of 66%.
- The ETH/BTC ratio is pressing into cup and handle resistance at 32 to 33 after bottoming near 18 in September 2025.
- A fresh wallet withdrew 40,000 ETH worth $82M from FalconX in 28 minutes, matching known Bitmine purchase patterns.
Bitcoin dominance has been sliding since July 2025, dropping from 66% to 58.61% on April 4 as capital gradually rotates out of BTC and into the broader market. The ETH/BTC ratio is simultaneously pressing into the resistance level of a cup and handle pattern that has been building for seven months. On the same day, an unidentified wallet pulled $82M in ETH from FalconX in under 30 minutes.
ETH Daily Chart: Bollinger Bands Compress At A Decision Point
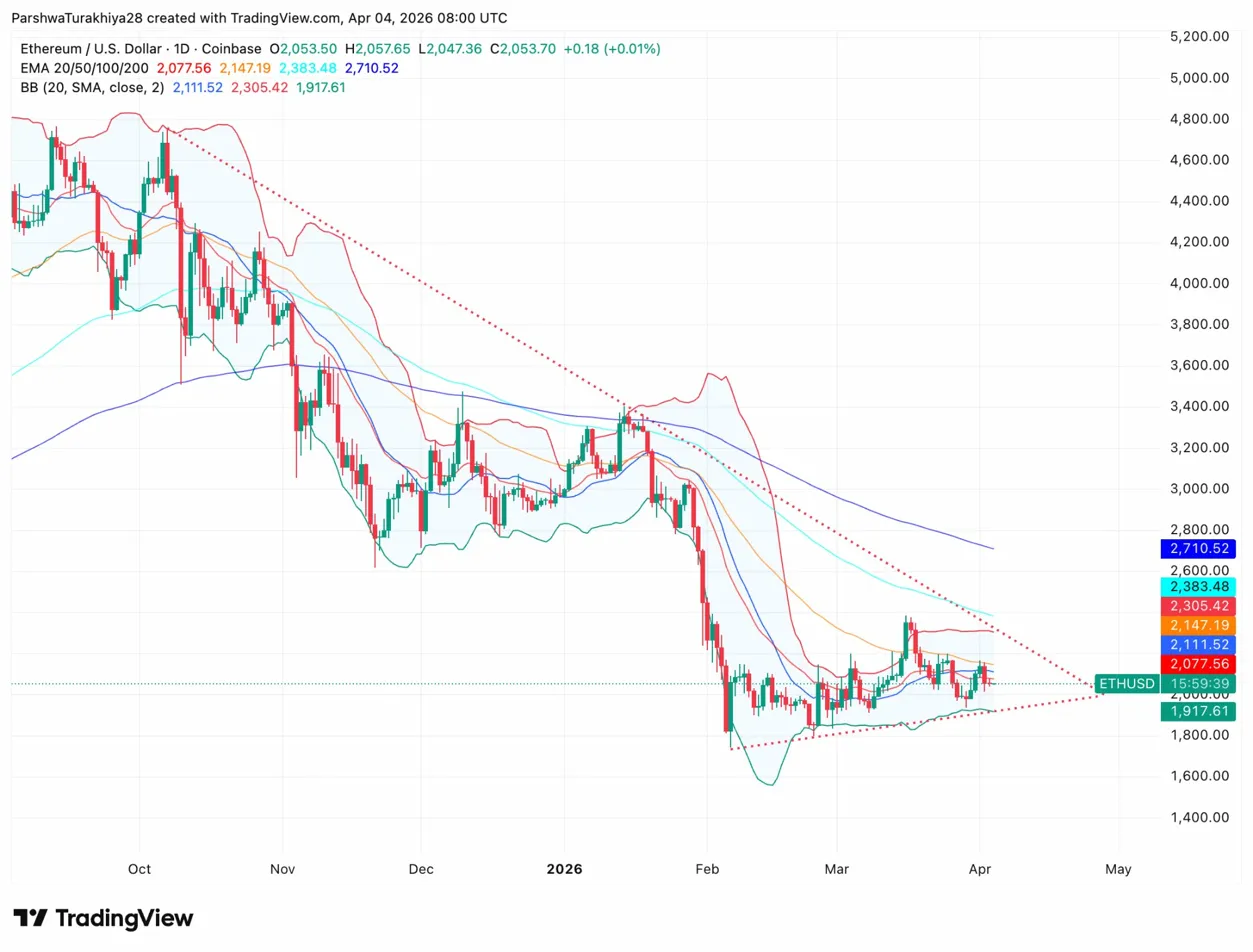
ETH Daily Price Action (Source: TradingView)
ETH peaked near $4,000 in November 2025 and has been declining since, but the selling pressure has eased through March and the Bollinger Bands have compressed sharply as a result. The lower band sits at $1,917, the middle band at $2,111, and the upper band at $2,305, with price at $2,053 trading between the lower and middle bands.
All four EMAs are overhead and declining: the 20-day at $2,077, the 50-day at $2,147, the 100-day at $2,383, and the 200-day at $2,710. The descending trendline from the November high converges toward the $2,100 to $2,150 zone, aligning with the EMA cluster. A daily close above the middle band at $2,111 and the 20-day EMA at $2,077 would be the first meaningful structural shift since February.
Key levels:
- Lower Bollinger Band: $1,917
- 20-day EMA: $2,077
- Middle Bollinger Band: $2,111
- 50-day EMA: $2,147
- Upper Bollinger Band: $2,305
- February low: $1,750
BTC Dominance Is Falling And History Says That Matters
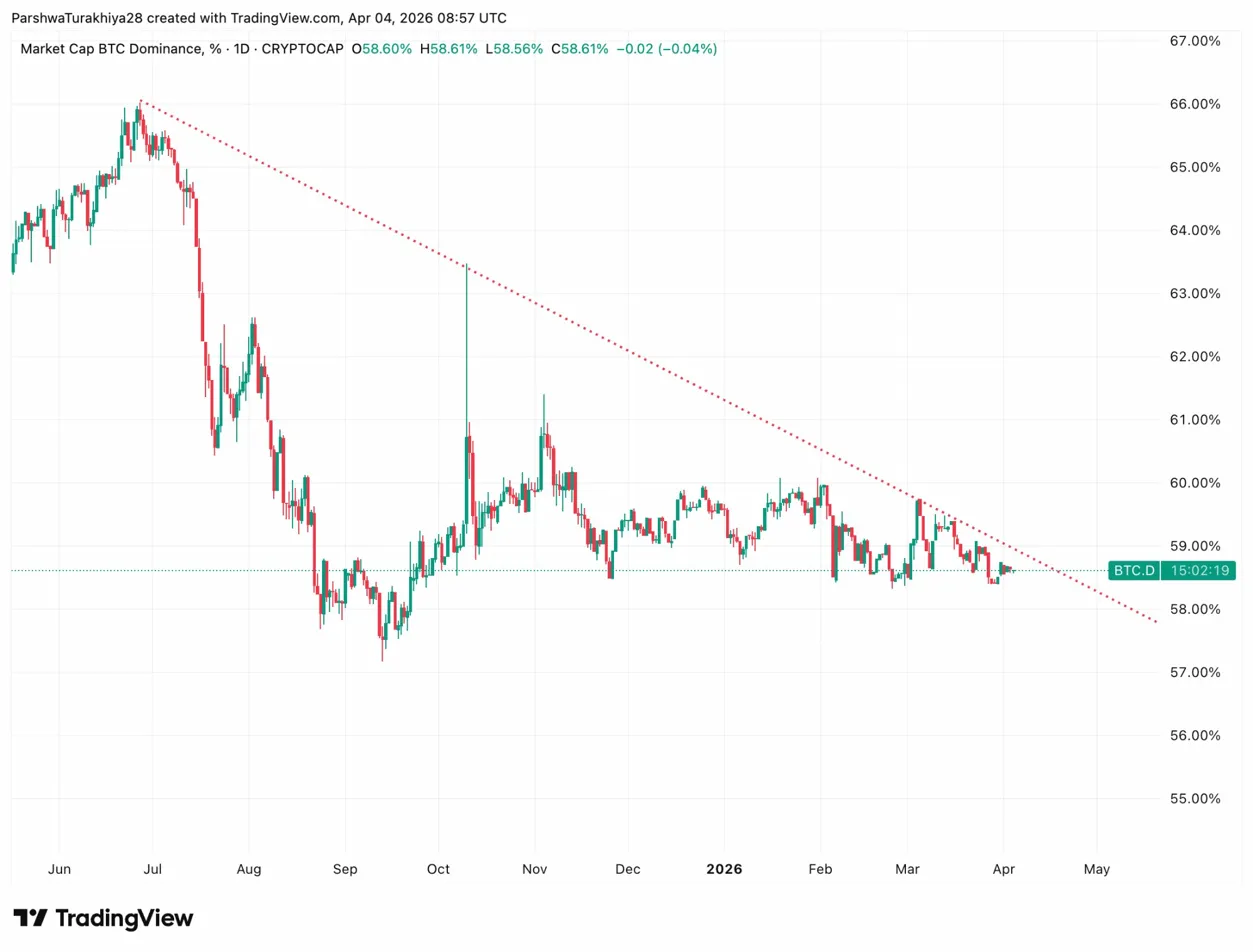
BTC Dominance Daily (Source: CRYPTOCAP)
Bitcoin’s share of the total crypto market cap peaked at 66% in July 2025 and has been declining ever since. The descending trendline from that peak is steep and unbroken, with dominance now at 58.61% and pressing toward the 58% level that has acted as a floor twice before. Each time BTC dominance breaks below a key support, capital flows into altcoins and ETH tends to lead that rotation.
The dominance chart is not signaling a collapse in Bitcoin. It is signaling that Bitcoin’s relative weight in the market is shrinking while other assets, ETH in particular, absorb a growing share of capital allocation. That process tends to accelerate once institutional buyers step in with size, which is exactly what the Arkham data shows happening today.
The ETH/BTC Ratio: Cup And Handle At The Breakout Level
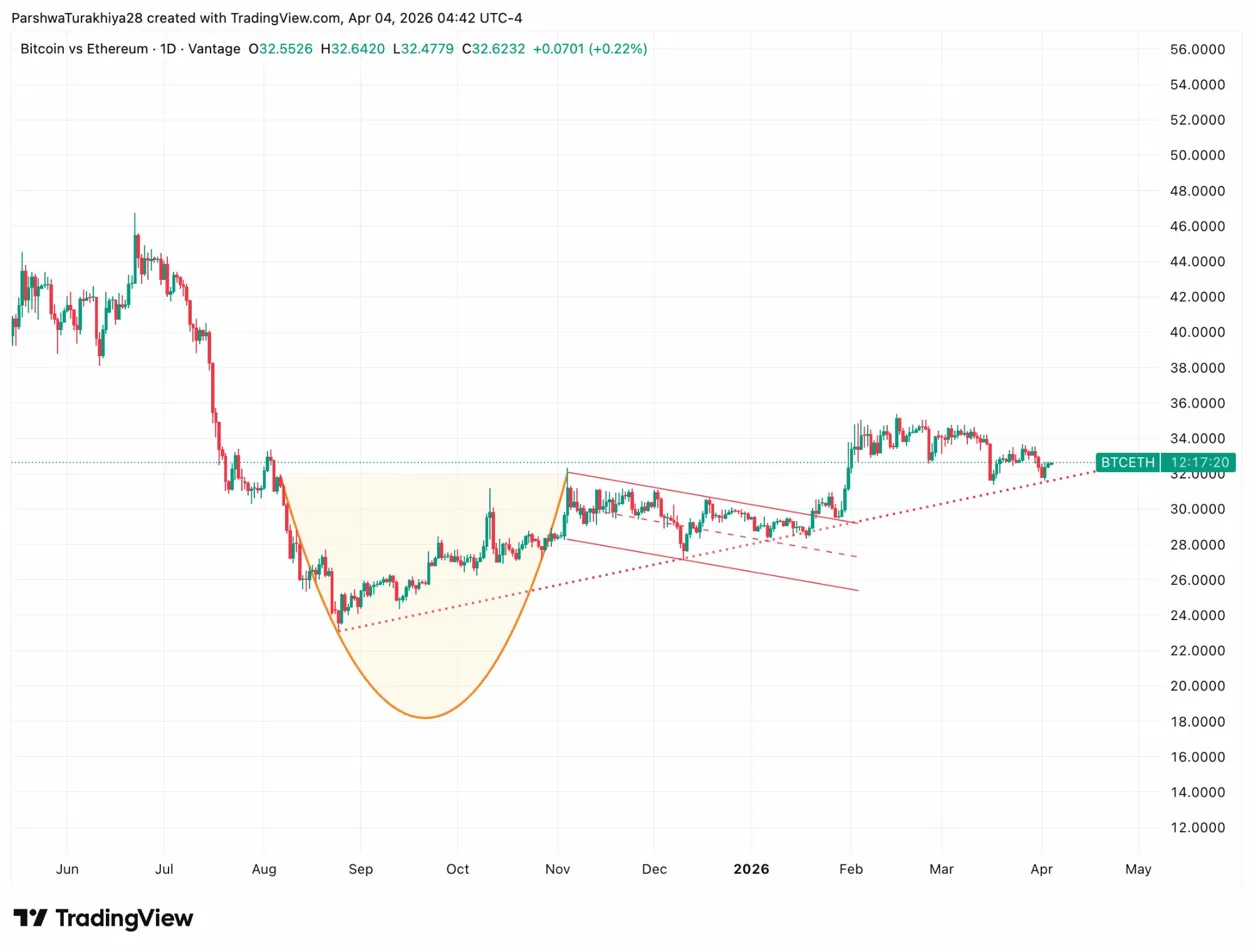
ETH/BTC Daily Ratio (Source: TradingView)
The ETH/BTC ratio bottomed near 18 in September 2025 after months of ETH underperforming Bitcoin. From that low, price curved up in a rounded cup formation, completing the right side in November. Since then, the ratio has been consolidating in a descending channel between 27 and 33, forming the handle of the pattern.
Price is now pressing into the channel’s upper boundary near 32 to 33, with the ascending trendline from the September low providing support from below. A daily close above 33 completes the cup and handle and signals a sustained shift in ETH outperformance over Bitcoin. When the ETH/BTC ratio breaks out, capital historically flows from Bitcoin into Ethereum first and then spreads into smaller altcoins.
The $82M Withdrawal That Fits The Narrative
Two transfers of 20,000 ETH each left FalconX’s hot wallet within 28 minutes on April 4, landing in a fresh address with no prior transaction history. The wallet holds the full 40,000 ETH with no outflows. Arkham flagged the purchase pattern as matching how Bitmine, a publicly listed company building an ETH treasury similar to what Strategy did with Bitcoin, has bought previously. Arkham publicly raised the question of whether Tom Lee is behind the purchase.
If confirmed as a Bitmine buy, this ranks among the largest single-day institutional ETH purchases of 2026, arriving on the same day BTC dominance presses toward its floor and the ETH/BTC ratio tests its most important resistance level in seven months.
Disclaimer: The information presented in this article is for informational and educational purposes only. The article does not constitute financial advice or advice of any kind. Coin Edition is not responsible for any losses incurred as a result of the utilization of content, products, or services mentioned. Readers are advised to exercise caution before taking any action related to the company.
 Price Prediction 2026, 2027, 2028, 2029, 2030-2050")


