


- Ethereum price analysis indicates a firm uptrend.
- ETH is facing resistance at $1,650.0.
- Strong support is found at $1,600.0.
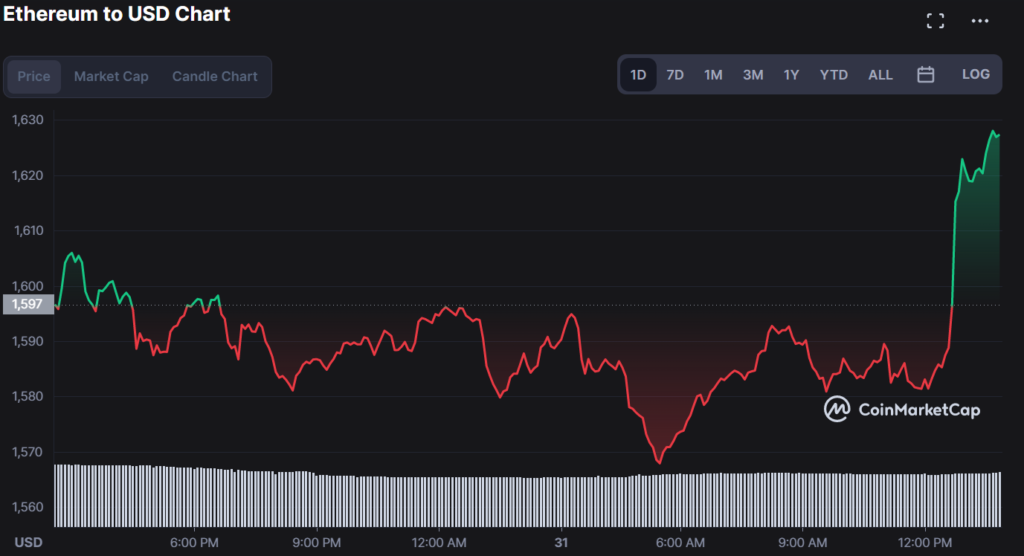
Recent Ethereum price analysis indicates that ETH opened the weekly trading chart at $1,568.0 and has seen a steady uptrend since then, breaking above the psychological level of $1,600 to trade at $1,625.67 at press time.
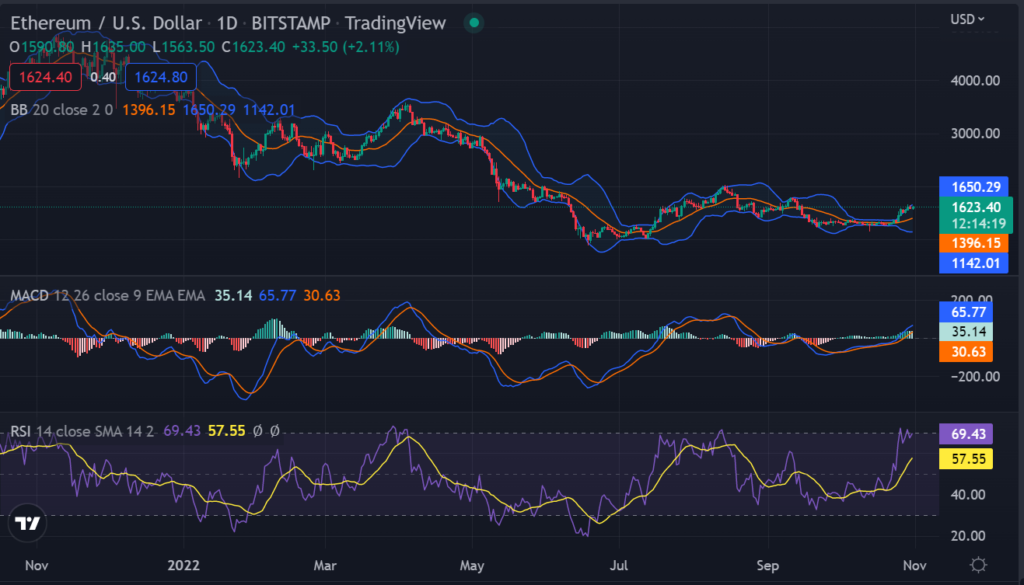
ETH/USD price has remained well above the 200-day moving average and is facing resistance at $1,650.0. The 50-day SMA has crossed above the 200-day SMA, indicating a bullish trend in the market. However, it is worth noting that ETH has been trading sideways for a significant period before this price surge, indicating that a corrective phase could still be possible.
Moreover, it should be noted that the Relative Strength Index (RSI) indicator on the daily chart shows ETH potentially being overbought. This could lead to a corrective phase in the near term. Strong support levels for ETH/USD are found at $1,600.0 and $1,550.0.
The entire cryptocurrency market has recently seen a surge, with Bitcoin breaking above the $20,000 mark and altcoins such as Dogecoin also recording significant gains.
The technical analysis on the 4-hour chart shows the ETH/USD pair formed an ascending triangle pattern, indicating a potential breakout in the bullish direction. The bulls are currently defending the triangle support at $1,625.0, and the bulls will aim to break above the triangle resistance at $1,650.0 for further gains.
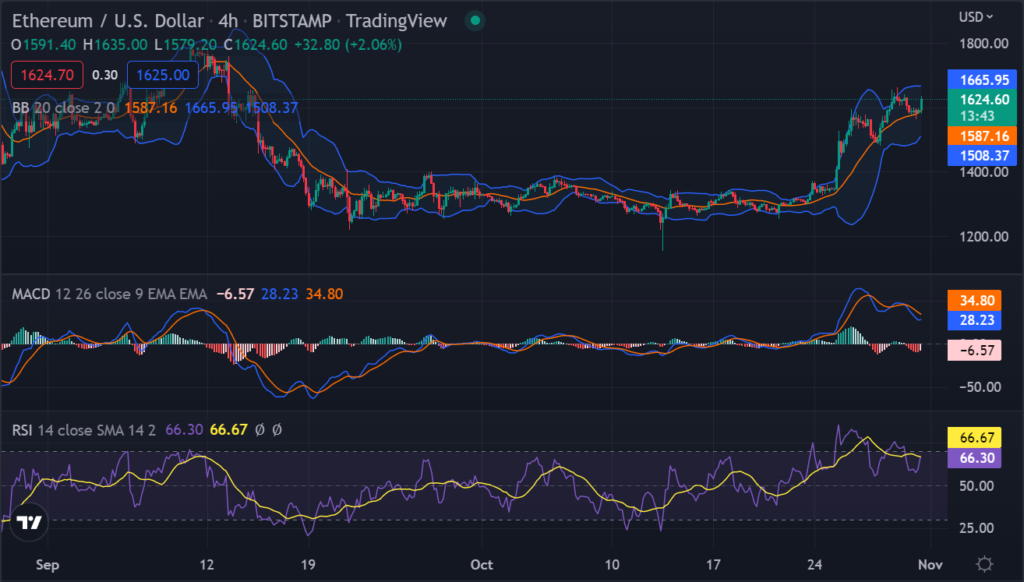
The Moving Average Convergence Divergence (MACD) also shows increasing bullish momentum in the market as the MACD line is on the verge of crossing above the signal line. Other technical indicators, such as the Parabolic SAR and the Bollinger Bands, also support the bullish outlook for ETH.
The dots of the Parabolic SAR are below the price candles, and the Bollinger Bands are widening, indicating increasing volatility in the market. Additionally, the Fib retracement levels show ETH facing strong support at the 23.6% level at $1,612.0 and strong resistance at the 38.2% level at $1,683.0.
Overall, Ethereum price analysis indicates a firm uptrend in the market with the potential for a corrective phase in the near term. However, with overall bullish momentum in the cryptocurrency market, ETH may continue to break above resistance levels and record further gains in the coming days.
Disclaimer: The views and opinions, as well as all the information shared in this price analysis, are published in good faith. Readers must do their own research and due diligence. Any action taken by the reader is strictly at their own risk. Coin Edition and its affiliates will not be held liable for any direct or indirect damage or loss.
Disclaimer: The information presented in this article is for informational and educational purposes only. The article does not constitute financial advice or advice of any kind. Coin Edition is not responsible for any losses incurred as a result of the utilization of content, products, or services mentioned. Readers are advised to exercise caution before taking any action related to the company.


