


 Weekly Chart Reveals Possible $3K Target")
- Breakout patterns on ETH’s weekly chart suggested that the altcoin may rise to $3K in the next few months.
- If these patterns are validated, the altcoin’s price may enter into a rally between the end of this year and Q1 of 2024.
- According to CoinMarketCap, ETH’s price dropped 2.40% in the past 24 hours, which left it trading at $1,575.07.
ETH’s short-term performance has been poor, to say the least. The altcoin leader’s price dropped over the past 24 hours, which also pushed its weekly and monthly performances further into the red zone. Despite this short-term bearish momentum, break-out patterns on ETH’s weekly chart suggested that the altcoin may rise to $3K in the next few months.
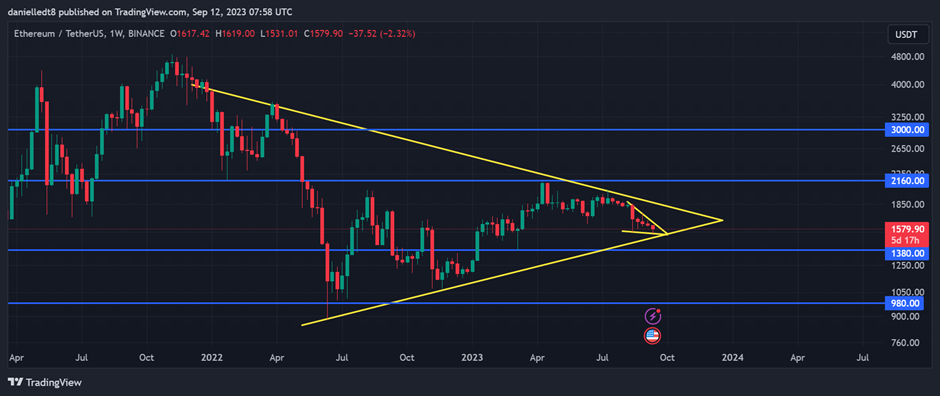
Investors and traders will want to take note of the 2 break-out patterns that have formed on ETH’s weekly chart. Zooming out on the chart revealed that a symmetrical triangle chart pattern formed on ETH’s weekly chart over the past few months. This suggested that the altcoin’s price may enter into a rally between the end of this year and Q1 of 2024.
Also Read: Ethereum Price Prediction
If this breakout is towards the upside, ETH’s price could attempt to flip the $2,160 resistance level into support over the following few weeks. Thereafter, a weekly close above this barrier will clear a path for ETH to rise to $3,000 in the subsequent couple of weeks.
Conversely, a bearish breakout could lead to ETH retesting the $1,380 support level. Continued sell pressure could result in the leading altcoin’s price then dropping to as low as $980 as well.
A bullish breakout is more likely to play out, however, given the formation of the second breakout chart pattern that had formed on ETH’s weekly chart over the past month. During this time, the cryptocurrency’s price printed lower lows and lower highs — resulting in the formation of a falling wedge chart pattern.
If this pattern is validated, then ETH may break out above the long-term symmetrical triangle pattern. Thereafter, ETH’s price may begin its quest to the aforementioned $3K mark in the following few weeks.
Meanwhile, like many other altcoins in the market, ETH experienced a price decline in the past day of trading. According to CoinMarketCap, ETH dropped 2.40% during this period. Consequently, at press time, ETH was valued at $1,575.07, placing it in the middle of its 24-hour high of $1,612.14 and its lowest point of $1,533.43 for the day.
Additionally, the drop in ETH’s price caused it to weaken against its competitor, Bitcoin (BTC) by about 2.22%. There was, however, a more than 89% increase in the altcoin’s 24-hour trading volume, which left it standing at $8,702,601,873.
When looking at the token’s longer-term performance, it was clear that ETH still had some work to do to get back into the green. Over the past seven days, ETH’s price dropped by 2.83%. Additionally, over the past month, the altcoin suffered a more than 14% loss.
Disclaimer: The views and opinions, as well as all the information shared in this price analysis, are published in good faith. Readers must do their own research and due diligence. Any action taken by the reader is strictly at their own risk. Coin Edition and its affiliates will not be held liable for any direct or indirect damage or loss.
Disclaimer: The information presented in this article is for informational and educational purposes only. The article does not constitute financial advice or advice of any kind. Coin Edition is not responsible for any losses incurred as a result of the utilization of content, products, or services mentioned. Readers are advised to exercise caution before taking any action related to the company.


