


- Santiment revealed in an X post earlier today that network fees for Ethereum have dropped to its lowest point in 2023.
- According to the post, historical drops in Ethereum’s fees have led to increased utility and market cap for ETH.
- From a technical perspective, a positive trend line had formed on ETH’s daily chart.
According to the blockchain intelligence platform Santiment, network fees for Ethereum (ETH) have dropped to their lowest levels for 2023, falling to just $1.15 per transaction. In the post, Santiment shared that historical drops in Ethereum’s network fees have led to increased utility, which subsequently resulted in the leading altcoin’s market cap rising.
Meanwhile, CoinMarketCap indicated that ETH recorded a 24-hour gain of 0.20%. As a result of the latest increase, the altcoin was changing hands at $1,594.40 at press time. The positive daily performance was, however, not enough to overcome ETH’s decline over the past 7 days. Consequently, ETH was still down 2.58% on the weekly timeframe.
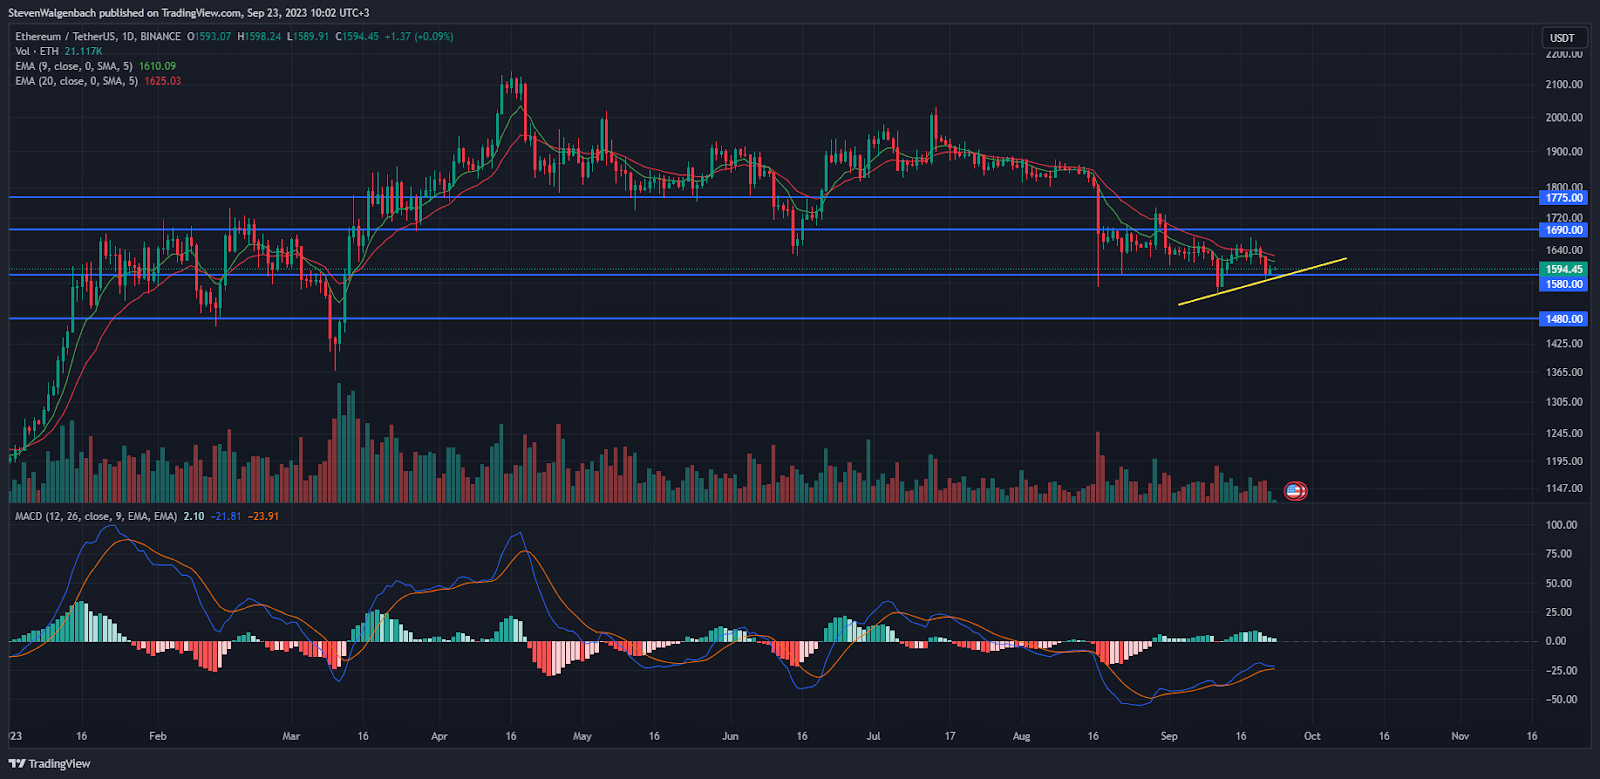
From a technical standpoint, ETH’s price dropped below the $1,580 support level during the past 72 hours. Bulls had identified the drop below this level as a buy opportunity, causing the cryptocurrency’s price to reclaim a position above the significant price point. This also led to ETH printing a second higher low and the formation of a positive trend line.
If this positive trend continues, then ETH’s price may attempt a challenge at the $1,690 barrier in the upcoming week. A daily candle close above this mark may then establish the foundation needed for the altcoin’s price to climb to $1,775 if buyers continue to provide support to the cryptocurrency.
On the other hand, if ETH’s price closes a daily candle below $1,580, it may be at risk of falling to the immediate support level at $1,480 in the following few days. Investors and traders will want to note that technical indicators on ETH’s daily chart suggested that a bearish outlook was more favorable.
Firstly, the 9-day EMA line was positioned below the 20-day EMA line. This indicated that ETH was in a medium-term trend. In addition to this, the daily MACD line was closing in on the daily MACD Signal line. If these two technical indicators cross, it will suggest a continuation of ETH’s bearish trend.
Disclaimer: The views and opinions, as well as all the information shared in this price analysis, are published in good faith. Readers must do their own research and due diligence. Any action taken by the reader is strictly at their own risk. Coin Edition and its affiliates will not be held liable for any direct or indirect damage or loss.
Disclaimer: The information presented in this article is for informational and educational purposes only. The article does not constitute financial advice or advice of any kind. Coin Edition is not responsible for any losses incurred as a result of the utilization of content, products, or services mentioned. Readers are advised to exercise caution before taking any action related to the company.


